(2: 河海大学浅水湖泊综合治理与资源开发教育部重点实验室, 南京 210098)
(3: 西北农林科技大学资源环境学院, 杨凌 712100)
(2: Key Laboratory of Integrated Regulation and Resource Development on Shallow Lakes, Ministry of Education, Hohai University, Nanjing 210098, P. R. China)
(3: College of Natural Resources and Environment, Northwest A & F University, Yangling 712100, P. R. China)
2007年太湖蓝藻水华引起无锡供水危机,使得太湖富营养化问题引起了公众和政府的高度关注[1-2].随后,国务院、水利部门及各级政府开展了一系列流域及湖泊综合治理措施以控制太湖富营养化,改善太湖水环境质量[3].
近10 a来,太湖流域的生活及工业污水集中处理、污水处理厂全面提标[4]和农业面源污染控制[5-6]等手段的实施,逐渐实现了流域外源污染的有效控制.自2008年以来,太湖湖区累计清淤底泥超过1亿m3,大规模的清淤大大减少了太湖的内源污染[7-10].而湖滨带生态修复等措施使得太湖的自净能力不断提高[11].近5 a,太湖蓝藻藻液(含水率>99 %)打捞量超过600万吨[9-10, 12-15]. 2010-2014年,年均生态调水量超过20亿m3,但2015和2016年,年调水量仅分别为9.62和4.81亿m3,远低于往年平均值[10-11, 15].蓝藻打捞和生态调水等措施,进一步改善了太湖水质.
近年来太湖水环境质量明显提升.截止2014年,太湖水质整体趋好[16-17],贡湖湾等湖区的沉水植物逐渐恢复[18],水生态系统逐渐向健康方向发展,个别年份水华发生频次和面积有所减少[19].但是,自2015年以来,太湖的水华发生频率、面积似乎有回升的趋势[19],2017年太湖水质与往年相比,出现了较为明显的波动.因此,须要对太湖近些年水质变化规律进行分析,明确其发展规律,判断其是否出现异常.这些分析对于正确理解太湖水质现状、影响因素以及更加科学地制定治理措施有着重要的参考价值.
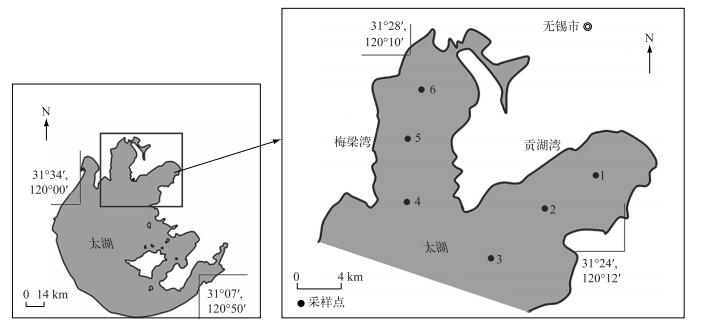
1 材料与方法 1.1 采样点布设选取太湖梅梁湾和贡湖湾作为太湖典型区域进行采样调查.梅梁湾是太湖富营养化最严重的湖湾之一,大规模微囊藻水华时有发生[20].贡湖湾水质相对较好,部分区域在春季有水草生长[18],但微囊藻水华仍时有发生[20],2007年的太湖蓝藻水华事件便是发生在贡湖湾[1].本研究在梅梁湾和贡湖湾各均匀布设3个采样点(图 1). 2010年4月至今,每月2次采集水样测定水质指标.
|
图 1 太湖梅梁湾和贡湖湾水样采集布点 Fig.1 Sampling sites in Meiliang Bay and Gonghu Bay of Lake Taihu |
由于微囊藻群体具有浮力,在风浪不大的条件下能够形成明显的垂向分布[21].在此情况下,表层水体中微囊藻藻密度较大,而水面以下微囊藻密度随深度逐渐减小.为避免上述因素对水质测定产生较大影响,本研究采集湖体表层水样和表层以下1 m处水样各500 ml,分别测定水质指标求平均值作为最终结果.此方法能够较为准确地反映太湖水柱水质的整体情况.
1.3 水质指标测定及水文气象数据收集本研究对太湖水样的总氮(TN)、总磷(TP)、溶解态总氮(DTN)和溶解态总磷(DTP)进行测定.其中,TN和TP浓度直接用太湖原水进行测定,DTN和DTP浓度则是先将水样用0.45 μm微孔滤膜过滤后再进行测定. TN和DTN浓度均采用碱性过硫酸钾消解分光光度法进行测定,TP和DTP浓度用过硫酸钾消解分光光度法进行测定[22].
本研究收集了太湖月平均温度、月平均风速和月平均水位数据.其中温度和风速数据来源于国家气象科学数据共享服务平台无锡站数据(区站号58354)(http://data.cma.cn/),水位数据来源于水利部太湖流域管理局流域公报.
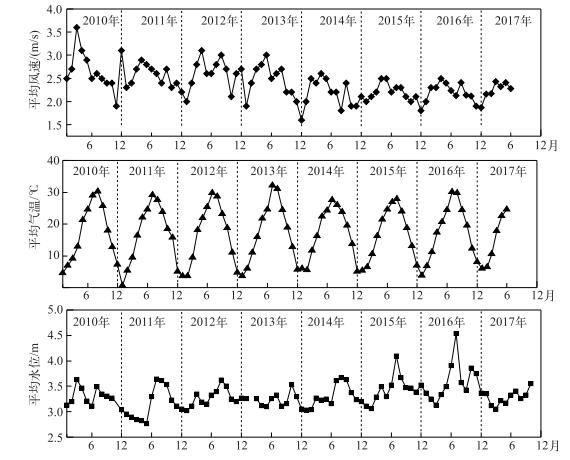
2 结果 2.1 太湖的水文气象数据太湖从2010年至今月平均气温并无明显变化,每年8月月平均气温最高,略高于30℃; 1月平均气温最低,一般都小于5℃.特别是在2011年1月,月平均气温接近0℃(图 2).
|
图 2 2010-2017年太湖(无锡站)逐月水文气象数据 Fig.2 Monthly hydrological and meteorological data of Lake Taihu (Wuxi Station) from 2010 to 2017 |
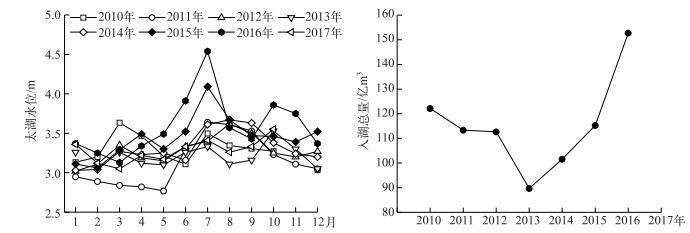
太湖风速近年间逐年减小,特别是在2015和2016年,月平均风速均小于2.5 m/s. 2017年风速比2015和2016年有所增大.太湖水位相对平稳,但2015和2016年水位较往年有所增加,特别是在2016年,太湖7月平均水位超过4.5 m,比往年月平均最高水位高出1.0 m(图 2).
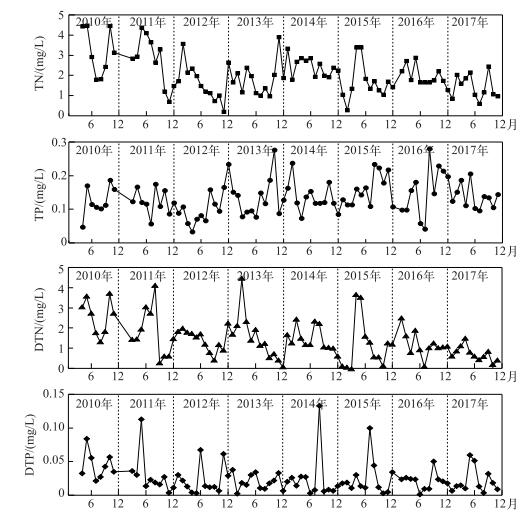
2.2 贡湖湾营养盐浓度的变化太湖贡湖湾从2010年至今TN和DTN浓度总体在波动中呈现下降的趋势,分别从4.5和3.5 mg/L下降至约1.0和0.5 mg/L(图 3).特别是2012年及之后的TN和DTN浓度均比2010-2011年降低了近50 %. 2015年以来DTN浓度降低幅度较大,TN浓度略有波动.
|
图 3 2010-2017年贡湖湾营养盐浓度的逐月数据 Fig.3 Monthly nutrient concentrations in Gonghu Bay from 2010 to 2017 |
2010年至今,贡湖湾TP和DTP浓度总体上呈现先下降后回升的趋势.其中,TP和DTP浓度在2010-2011年间波动中呈现下降的趋势,2015和2016年TP浓度比2014年有所上升,特别是2016年TP浓度峰值达到了近0.28 mg/L(图 3).
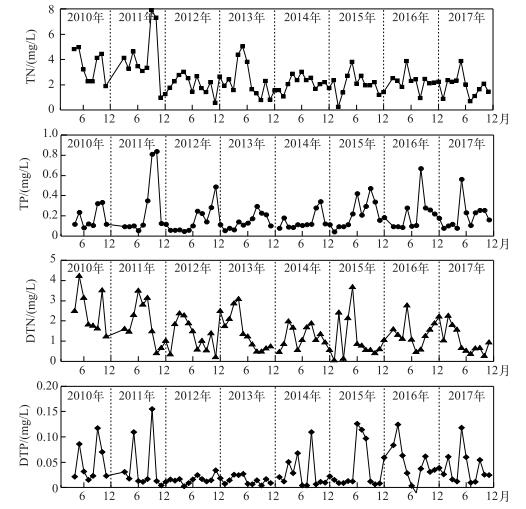
2.3 梅梁湾营养盐浓度的变化梅梁湾从2010年至今TN和DTN浓度总体在波动中呈现下降的趋势,特别是2010-2012年降幅较为明显,2013年以后呈现小幅波动但整体趋势依然是不断减小.梅梁湾TP和DTP浓度总体在波动中呈现先降低后回升的趋势.其中,2015和2016年TP浓度均比2014年有所回升,并且TP和DTP浓度随月份的波动幅度逐年增大,特别是TP浓度每年最大月平均值逐年上升,从约0.3 mg/L增长至近0.7 mg/L(图 4).
|
图 4 2010-2017年梅梁湾营养盐浓度的逐月数据 Fig.4 Monthly nutrient concentrations in Meiliang Bay from 2010 to 2017 |
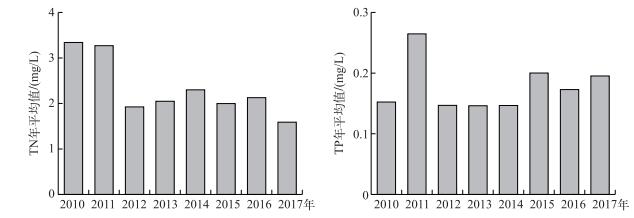
将梅梁湾和贡湖湾的数据平均以表征太湖今年来水质的平均值(图 5). 2010年至今TN年平均值总体在波动中呈现下降的趋势,特别是2012年比往年大幅降低.相比之下,TP浓度年平均值在2014年之前在波动中呈现下降的趋势,2015年开始略有上升,此后TP浓度较2014年一直处于高值.
|
图 5 2010-2017年太湖TN和TP浓度的年际变化 Fig.5 Annual concentrations of TN and TP in Lake Taihu from 2010 to 2017 |
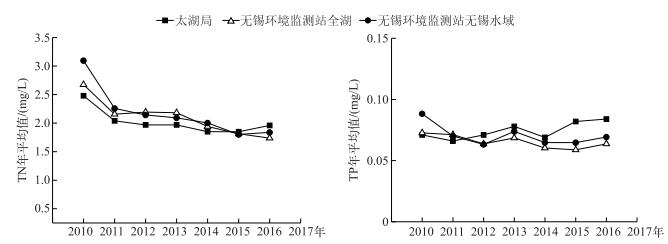
本研究近8 a的贡湖湾和梅梁湾水质数据显示,太湖水质整体趋好,TN浓度逐年下降,略有波动,而TP浓度从2014年起略有回升,以2014年数值为基数,太湖TP浓度在2015和2016年分别回升36.6 %和17.9 %.无锡环境监测站的数据也显示太湖TN浓度从2010年以来逐年减小,而TP浓度近2 a略有回升(图 6).以2014年为基数,太湖无锡水域2015和2016年TP浓度分别回升7.2 %和15.3 %.全太湖TP浓度2015年无明显回升,2016年回升约8 %.太湖局的数据则显现全太湖TP浓度在2015和2016年分别回升16.7 %和21.7 % (图 6).
|
图 6 本研究、无锡环境监测站、太湖局近8 a营养盐年平均值比较 Fig.6 Comparison of the annual average concentration of nutrient from this research, Wuxi Municipal Environmental Monitoring Station and Ministry of Water Resources Bureau of Taihu basin over the past eight years |
水利部太湖流域管理局(简称太湖局)对太湖水质的监测是对整个太湖所有湖区33个点位进行采样测定后取得平均值.由于东太湖湖区水质整体较好,平均计算会将太湖北部包括梅梁湾和贡湖湾在内的部分区域营养盐波动幅度稀释.这可能是太湖局数据显示2015和2016年太湖TP浓度回升比例较本研究低的原因.无锡环境监测站在测定营养盐浓度时,会先用25#浮游植物网(孔径64 μm)将微囊藻群体颗粒去除,因此其数据更多地反映出溶解态的氮、磷浓度.无锡环境监测站数据显示2015和2016年太湖TP浓度回升比例比太湖局和本研究的数据都小(图 6).这说明,颗粒态磷在2015和2016年太湖TP浓度回升中起到重要作用.此外,无锡监测站的数据还显示,太湖无锡水域TP浓度回升比例远远高于整个太湖TP浓度的回升比例(图 6),这进一步证明了太湖局全太湖的平均结果会将太湖北部包括梅梁湾和贡湖在内的部分区域营养盐波动幅度稀释.
尽管不同来源的太湖水质数据反映出来的太湖TP浓度回升比例不同,但所有数据均显示2015和2016年,太湖TP浓度呈现回升趋势, 而太湖TN浓度逐年下降,略有波动.因此,可以明确自2010年以来,太湖水质整体向好,TN和TP浓度在波动中呈现逐年下降的趋势,但TP浓度在2015年和2016年略有回升,三方数据略有差异,平均回升比例约为15 % ~20 %.
3.2 太湖TP浓度波动的原因分析一般认为风浪扰动促进太湖沉积物P的释放是影响太湖TP浓度的主要因素[23-24].然而气象数据显示(图 2),太湖风速近年间逐年减小,特别是TP浓度回升的2015和2016年,平均风速为近7 a最小.因此,可以断定,2015和2016年太湖TP浓度的回升并不是由于风浪扰动引起内源P释放引起的.
温度能够影响底泥中微生物的活性从而影响沉积物P的释放速率[25-26].但本研究获得的数据显示,太湖2010年至今逐年气温并无明显变化.因此,温度对太湖TP浓度的影响也可以排除.
无锡监测站的数据会受到太湖中微囊藻群体大小的影响.然而,大量研究显示在生长季太湖微囊藻的群体一般都大于100 μm,且不同年份间差异也不明显[20, 27].因此,也可以排除微囊藻群体大小变化对太湖TP浓度回升的影响.
除此之外,本研究数据显示2015和2016年,太湖TP浓度在7-9月间出现了峰值(图 3和图 4).然而,夏、秋季富营养化湖泊TP浓度回升是由于沉积物的厌氧环境[28]、水体pH升高[29-30]以及藻类大量生长消耗水体中DTP[31]等原因促进沉积物P释放造成的,属于浅水富营养化湖泊的普遍现象.此现象在太湖梅梁湾和贡湖湾的其他年份也经常出现.
需要注意的是,太湖在2015和2016年都遭遇了比较大的洪水,特别是2016年,太湖7月平均水位超过4.5 m,比往年月平均最高水位高出1 m(图 7).太湖2015和2016年入湖水量较正常年分别多出3和40亿m3(图 7).而且在行洪期间河道的水质与往年没有明显的差异,从太湖健康状况报告的数据看,2015和2016年的TN年负荷比正常年分别增加1500和6200 t,2015和2016年的TP年负荷比正常年分别增加200和500 t.
|
图 7 2010-2017年太湖水位的逐月变化及年入湖水量变化 Fig.7 Monthly variation in water level and annual variation in the amount of water flow into Lake Taihu from 2010 to 2017 |
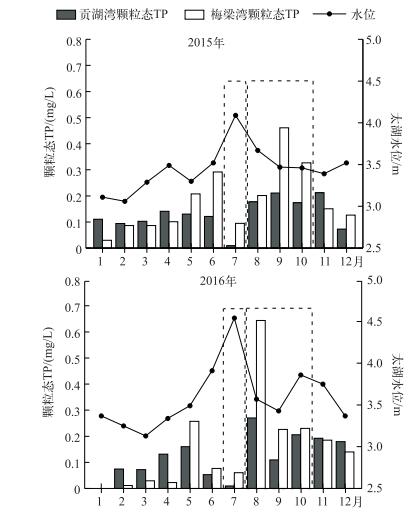
从太湖2015和2016年太湖水位与营养盐季节变化中可以发现,太湖水位出现峰值后,太湖TP浓度逐渐增加并出现峰值(图 8).但太湖TN浓度并未出现类似现象.同时,水位出现峰值后,颗粒态TP浓度明显上升并出现峰值(图 9).因此,太湖2015和2016年TP浓度回升过程中主要起作用的应该是颗粒态P.

|
图 8 2015和2016年太湖水位、氮和磷浓度的逐月变化 Fig.8 Monthly variation in water level, concentrations of nitrogen and phosphorus in Lake Taihu in 2015 and 2016 |
|
图 9 2015和2016年太湖水位和颗粒态TP浓度逐月变化 Fig.9 Monthly variation in water level, concentrations of particle TP in Lake Taihu in 2015 and 2016 |
综上所述可以推断,2015和2016年的2次大洪水过程携带大量N、P进入太湖湖区,洪水消退过程中,N大多以溶解态排泄出湖区,而P则由于大多数以颗粒态存在,逐渐沉积到湖泊中,随着微囊藻生长消耗水体溶解态P以及水体pH和溶解氧的变化逐渐释放到太湖水体中.这是太湖2015和2016年TP浓度出现回升的主要原因.
4 结论本研究显示,太湖自2010年以来,水质整体向好,TN浓度在波动中呈现下降的趋势,TP浓度在2014年前也是在波动中呈现下降的趋势,但2015和2016年有所回升,回升比例约为15 % ~20 %. 2015年和2016年TP浓度出现回升的主要原因是这两年的两次大洪水过程携带大量N、P进入太湖湖区,洪水消退过程中,N大多以溶解态排泄出湖区,而P则由于大多数以颗粒态存在,逐渐沉积到湖泊中,随着微囊藻生长消耗水体溶解态P以及水体pH和溶解氧的变化逐渐释放到太湖水体中.
| [1] |
Guo L. Doing battle with the green monster of Taihu Lake. Science, 2007, 317(5842): 1166-1166. DOI:10.1126/science.317.5842.1166 |
| [2] |
Zhang XJ, Chen C, Ding J et al. The 2007 water crisis in Wuxi, China:Analysis of the origin. Journal of Hazardous Materials, 2010, 182(1): 130-135. DOI:10.1016/j.jhazmat.2010.06.006 |
| [3] |
Li JC. Total control and water pollution control in Taihu Basin-A review of "Overall Plan for Integrated Water Environment Management in Taihu Lake Basin". Environmental Pollution and Prevention, 2010, 32(4): 96-100. [李家才. 总量控制与太湖流域水污染治理——《太湖流域水环境综合治理总体方案》述评. 环境污染与防治, 2010, 32(4): 96-100.] |
| [4] |
He LJ, Wang Y, Huang H et al. Summary of technical innovations for upgrading and retrofitting of MWWTPs for First Level A Criteria in Taihu Lake Basin of Jiangsu Province. China Water & Wastewater, 2011, 27(10): 33-39. [何伶俊, 汪勇, 黄皓等. 江苏太湖流域污水处理厂一级A提标改造技术总结. 中国给水排水, 2011, 27(10): 33-39.] |
| [5] |
Yan LZ, Shi MJ, Wang L. Review of agricultural non-point pollution in Lake Taihu and Taihu Basin. China Population, Resources and Environment, 2010, 20(1): 99-107. [闫丽珍, 石敏俊, 王磊. 太湖流域农业面源污染及控制研究进展. 中国人口·资源与环境, 2010, 20(1): 99-107.] |
| [6] |
Zhang HJ, Chen F. Non-point pollution statistics and control measures in Taihu Basin. Water Resources Protection, 2010, 26(3): 87-90. [张红举, 陈方. 太湖流域面源污染现状及控制途径. 水资源保护, 2010, 26(3): 87-90.] |
| [7] |
Water resources department of the Taihu basin, Jiangsu provincial department of water resources, Zhejiang provincial department of water resources, Shanghai municipal water bureau eds. Taihu health report. 2008. [水利部太湖流域管理局, 江苏省水利厅, 浙江省水利厅, 上海市水务局. 太湖健康状况报告. 2008. ]
|
| [8] |
Water resources department of the Taihu basin, Jiangsu provincial department of water resources, Zhejiang provincial department of water resources, Shanghai municipal water bureau eds. Taihu health report. 2009. [水利部太湖流域管理局, 江苏省水利厅, 浙江省水利厅, 上海市水务局. 太湖健康状况报告. 2009. ]
|
| [9] |
Water resources department of the Taihu basin, Jiangsu provincial department of water resources, Zhejiang provincial department of water resources, Shanghai municipal water bureau eds. Taihu health report. 2013. [水利部太湖流域管理局, 江苏省水利厅, 浙江省水利厅, 上海市水务局. 太湖健康状况报告. 2013. ]
|
| [10] |
Water resources department of the Taihu basin, Jiangsu provincial department of water resources, Zhejiang provincial department of water resources, Shanghai municipal water bureau eds. Taihu health report. 2014. [水利部太湖流域管理局, 江苏省水利厅, 浙江省水利厅, 上海市水务局. 太湖健康状况报告. 2014. ]
|
| [11] |
Water resources department of the Taihu basin, Jiangsu provincial department of water resources, Zhejiang provincial department of water resources, Shanghai municipal water bureau eds. Taihu health report. 2015. [水利部太湖流域管理局, 江苏省水利厅, 浙江省水利厅, 上海市水务局. 太湖健康状况报告. 2015. ]
|
| [12] |
Water resources department of the Taihu basin, Jiangsu provincial department of water resources, Zhejiang provincial department of water resources, Shanghai municipal water bureau, Taihu health report. 2010. [水利部太湖流域管理局, 江苏省水利厅, 浙江省水利厅, 上海市水务局. 太湖健康状况报告. 2010. ]
|
| [13] |
Water resources department of the Taihu basin, Jiangsu provincial department of water resources, Zhejiang provincial department of water resources, Shanghai municipal water bureau eds. Taihu health report. 2011. [水利部太湖流域管理局, 江苏省水利厅, 浙江省水利厅, 上海市水务局. 太湖健康状况报告. 2011. ]
|
| [14] |
Water resources department of the Taihu basin, Jiangsu provincial department of water resources, Zhejiang provincial department of water resources, Shanghai municipal water bureau eds. Taihu health report. 2012. [水利部太湖流域管理局, 江苏省水利厅, 浙江省水利厅, 上海市水务局. 太湖健康状况报告. 2012. ]
|
| [15] |
Water resources department of the Taihu basin, Jiangsu provincial department of water resources, Zhejiang provincial department of water resources, Shanghai municipal water bureau eds. Taihu health report 2016. [水利部太湖流域管理局, 江苏省水利厅, 浙江省水利厅, 上海市水务局. 太湖健康状况报告. 2016. ]
|
| [16] |
Zhang L, Fan KX, Zheng H et al. Application of water quality identification index method in water quality evaluation of Taihu Lake. Journal of Aquaculture, 2016, 37(1): 35-40. [张莉, 樊祥科, 郑浩等. 水质标识指数法在太湖渔业生态环境评价中的应用. 水产养殖, 2016, 37(1): 35-40.] |
| [17] |
Dai XL, Qian PQ, Ye L et al. Changes in nitrogen phosphorus concentrations in Lake Taihu, 1985-2015. J Lake Sci, 2016, 28(5): 935-943. [戴秀丽, 钱佩琪, 叶凉等. 太湖水体氮、磷浓度演变趋势(1985-2015年). 湖泊科学, 2016, 28(5): 935-943. DOI:10.18307/2016.0502] |
| [18] |
Wu DH, Wang Y, Xu ZA. Hydroacoustic investigation of submerged macrophyte coverage in Gonghu Bay, Taihu Lake. Journal of China Hydrology, 2016, 36(4): 44-47. [吴东浩, 王玉, 徐兆安. 基于水声学的太湖贡湖湾沉水植物盖度调查. 水文, 2016, 36(4): 44-47.] |
| [19] |
Yang Z, Zhang M, Shi X et al. Nutrient reduction magnifies the impact of extreme weather on cyanobacterial bloom formation in large shallow Lake Taihu(China). Water Research, 2016, 103: 302-310. DOI:10.1016/j.watres.2016.07.047 |
| [20] |
Lin L, Appiah-Sefah G, Li M. Using a laser particle analyzer to demonstrate relationships between wind strength and Microcystis colony size distribution in Lake Taihu, China. Journal of Freshwater Ecology, 2015, 30(3): 425-433. DOI:10.1080/02705060.2014.976666 |
| [21] |
Zhu W, Li M, Luo Y et al. Vertical distribution of Microcystis colony size in Lake Taihu:Its role in algal blooms. Journal of Great Lakes Research, 2014, 40(4): 949-955. DOI:10.1016/j.jglr.2014.09.009 |
| [22] |
Ebina J, Tsutsui T, Shirai T. Simultaneous determination of total nitrogen and total phosphorus in water using peroxodisulfate oxidation. Water Research, 1983, 17(12): 1721-1726. DOI:10.1016/0043-1354(83)90192-6 |
| [23] |
Søndergaard M, Kristensen P, Jeppesen E. Phosphorus release from resuspended sediment in the shallow and wind-exposed Lake Arresø, Denmark. Hydrobiologia, 1992, 228(1): 91-99. DOI:10.1007/BF00006480 |
| [24] |
Marsden MW. Lake restoration by reducing external phosphorus loading:The influence of sediment phosphorus release. Freshwater Biology, 1989, 21(2): 139-162. DOI:10.1111/j.1365-2427.1989.tb01355.x |
| [25] |
Jiang X, Jin X, Yao Y et al. Effects of biological activity, light, temperature and oxygen on phosphorus release processes at the sediment and water interface of Taihu Lake, China. Water Research, 2008, 42(8): 2251-2259. DOI:10.1016/j.watres.2007.12.003 |
| [26] |
Qin BQ, Fan CX. Exploration of conceptual model of nutrient release from inner source in large shallow lake. China Environmental Science, 2002, 22(2): 150-153. [秦伯强, 范成新. 大型浅水湖泊内源营养盐释放的概念性模式探讨. 中国环境科学, 2002, 22(2): 150-153.] |
| [27] |
Li M, Zhu W, Gao L et al. Seasonal variations of morphospecies composition and colony size of Microcystis in a shallow hypertrophic lake (Lake Taihu, China). Fresenius Environmental Bulletin, 2013, 22: 3474-3483. |
| [28] |
Spears BM, Carvalho L, Perkins R et al. Sediment phosphorus cycling in a large shallow lake:Spatio-temporal variation in phosphorus pools and release. Hydrobiologia, 2007, 584(1): 37-48. DOI:10.1007/s10750-007-0610-0 |
| [29] |
Istvanovics V. Seasonal variation of phosphorus release from the sediments of shallow Lake Balaton (Hungary). Water Research, 1988, 22(12): 1473-1481. DOI:10.1016/0043-1354(88)90158-3 |
| [30] |
Jin X, Wang S, Pang Y et al. Phosphorus fractions and the effect of pH on the phosphorus release of the sediments from different trophic areas in Taihu Lake, China. Environmental Pollution, 2006, 139(2): 288-295. DOI:10.1016/j.envpol.2005.05.010 |
| [31] |
Xie L, Xie P, Li S et al. The low TN:TP ratio, a cause or a result of Microcystis blooms?. Water Research, 2003, 37(9): 2073-2080. DOI:10.1016/S0043-1354(02)00532-8 |
 2018, Vol. 30
