(2: 长江科学院流域水资源与生态环境科学湖北省重点实验室, 武汉 430010)
(3: 长江科学院院长办公室, 武汉 430010)
(2: Hubei Provincial Key Lab of Basin Water Resource and Eco-Environmental Science, Changjiang River Scientific Research Institute, Wuhan 430010, P. R. China)
(3: Administration Office, Changjiang River Scientific Research Institute, Wuhan 430010, P. R. China)
多环芳烃(PAHs)和邻苯二甲酸酯类(PAEs)是环境中广泛存在的持久性有毒污染物[1-6]. PAHs具有毒性和致癌作用,主要来源于含碳物质的不完全燃烧[7]. PAEs作为增塑剂被广泛使用[8],属于内分泌干扰物[3, 9].我国《地表水环境质量标准》(GB 3838-2002)对地表水中PAHs和PAEs浓度均有限制要求[10].
三峡工程是世界上最大的水利枢纽工程,在防洪、发电、航运和供水方面发挥了显著的效益[11].三峡水库的水质对于人类和生态系统健康具有重要意义.从天然状态至175 m蓄水,三峡水库水文情势发生了巨大变化,水流减缓显著降低了水中污染物的扩散和自净能力,污染物的沉降和运移规律也相应改变[12].三峡水库的水质问题日益引起广泛关注.
PAHs被认为是三峡库区首要的有毒污染物[12-14].目前关于三峡库区水体和底泥中PAHs的浓度和来源虽然已有研究[7, 15-16],但长期跟踪监测和分析对于库区水质管理十分必要.据报道PAEs是三峡工程175 m蓄水前库区水体中的主要污染物之一[17]. 2005年,邻苯二甲酸二正丁酯(DBP)和邻苯二甲酸(2-乙基已基)酯(DEHP)浓度分别为0.83~2.21和0.66~3.60 μg/L[17].关于三峡工程175 m蓄水后库区水体和底泥中PAEs浓度和污染来源的报道极少.开展三峡工程蓄水后库区主要持久性有机污染物PAHs和PAEs在水体和底泥中的含量、分布与来源研究,对于三峡库区生态环境安全具有重要意义.
本文系统研究了三峡水库水体和底泥中PAHs和PAEs的浓度、分布和主要来源.采集了2016年三峡水库放水期(6月)和蓄水期(12月)干支流18个采样点的水样和底泥样品,分析了不同水期下污染物的时空分布和来源特征.调查的污染物包括美国环境保护局(EPA)优先污染物名单中所列的16种PAHs和6种PAEs.本研究结果可为三峡库区未来开展水质监测和污染控制提供理论依据.
1 材料和方法 1.1 化学品和试剂16种PAHs包括萘(Nap)、苊(Ace)、二氢苊(Acy)、芴(Flu)、菲(Phe)、蒽(Ant)、荧蒽(Fla)、芘(Pyr)、苯并蒽(BaA)、屈(Chr)、苯并[b]荧蒽(BbF)、苯并[k]荧蒽(BkF)、苯并[a]芘(BaP)、茚并芘(InP)、二苯并[a, h]蒽(DahA)和苯并[g, h, i]苝(BghiP). 6种PAEs包括邻苯二甲酸二甲酯(DMP)、邻苯二甲酸二乙酯(DEP)、邻苯二甲酸二正丁酯(DBP)、邻苯二甲酸丁基苄酯(BBP)、邻苯二甲酸(2-乙基已基)酯(DEHP)和邻苯二甲酸二正辛酯(DNOP). PAHs混合标准储备液(Lot 214101426, 99 %)和PAEs混合标准储备液(Lot 214031130, 99 %)均由AccuStandard公司提供.二氯甲烷、丙酮和乙酸乙酯均为色谱纯,由美国Fisher Chemical公司提供.正己烷为色谱纯,由美国TEDIA公司提供.
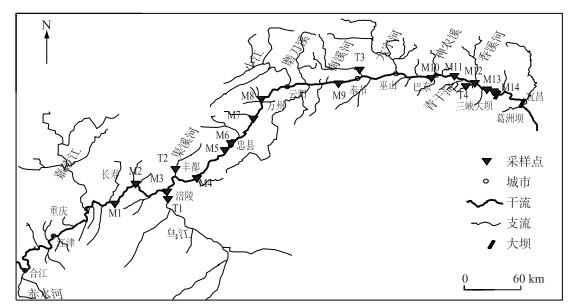
1.2 样品采集本研究共设置三峡库区干流14个采样点(M1~M14)和支流4个采样点(T1~T4)(图 1).水样和底泥样品分别采集于2016年6月(放水期)和12月(蓄水期). 4条支流包括乌江、渠溪河、梅溪河和青干河.采用4 L不锈钢小桶采集0~50 cm表层水体,采集后过0.45 μm滤膜并保存于4 L棕色瓶中.采用抓斗式采泥器采集表层底泥,采集后保存于封口袋中.所有的水体和底泥样品尽快运回实验室,并于4℃保存待分析.

|
图 1 三峡库区采样点分布 Fig.1 Distribution of sampling sites in the Three Georges Reservoir |
采用C18固相萃取膜(ENVI-18 DSK,47 mm直径,Sigma-Aldrich, USA)萃取水体样品中的PAHs和PAEs[18-19].萃取后固相萃取膜采用10 ml乙酸乙酯洗脱1次,加10 ml乙酸乙酯重复洗脱1次,再采用10 ml(1+1)二氯甲烷-乙酸乙酯洗脱1次,以上洗脱步骤重复2次.将所有洗脱液收集后,除水并浓缩至近干,用正己烷定容至1.0 ml,上机分析.
底泥样品经真空冷冻干燥、研磨、过筛,取约2 g(精确到0.0001 g)加入25 ml(1+1)己烷-丙酮混合溶剂,采用微波萃取.微波萃取条件为:自室温(30℃)以10℃/min的速度升温至120℃,保持20 min.硅胶-氧化铝复合柱采用湿法填柱,自下而上依次填入0.5 cm无水硫酸钠、3 cm中性氧化铝、3 cm中性硅胶和1 cm无水硫酸钠,净化柱用10 ml正己烷、10 ml(7+3)正己烷与二氯甲烷混合溶剂预冲洗.将萃取液通过硅胶-氧化铝复合柱,然后采用20 ml正己烷、20 ml(7+3)正己烷与二氯甲烷混合溶剂淋洗柱子.将所有洗脱液收集后,出水并浓缩至近干,用正己烷定容至1.0 ml,上机分析.
16种PAHs和6种PAEs采用GC-MS(7890B/5977A, Agilent, USA)检测.采用DB-5MS色谱柱,质谱条件为EI模式,离子源温度为250℃;扫描方式为SIM,载气均为高纯氮气(≥99.999 %),不分流进样,进样体积1 μl. PAHs检测色谱条件为:进样口温度250℃、传输线温度300℃、流速1 ml/min;升温程序为:80℃保持2 min,以20℃/min升温至220℃,保持10 min,再以2℃/min升温至300℃,保持5 min. PAEs检测色谱条件为:进样口温度250℃、传输线温度300℃、流速1.2 ml/min;升温程序为:70℃保持2 min,以20℃/min升温至130℃,再以5℃/min升温至200℃,15℃/min升温至300℃,保持5 min.
1.4 质量控制16种PAHs和6种PAEs采用外标法进行质量控制.为避免分析过程中引起的污染,每分析10个样品做一个样品空白.样品上机分析测试时按10 %比例抽取样品开展平行试验.所有样品均上机测试3次并取平均值.所有标准曲线相关系数均大于0.994.底泥样品中PAHs和PAEs含量均以干重法计算(ng/g(dw)).水体样品中16种PAHs的方法检出限为0.04~0.39 ng/L,底泥样品中16种PAHs的方法检出限为0.08~0.78 ng/g.水样中6种PAEs的方法检出限为0.12~0.92 ng/L,底泥样品中6种PAEs的方法检出限为0.25~1.85 ng/g.水体和底泥样品中16种PAHs的加标回收率分别为80.34 % ~112.06 %和59.87 % ~80.75 %,6种PAEs的加标回收率分别为86.90 % ~110.12 %和63.93 % ~75.54 %.
1.5 数据分析采用主成分分析法(PCA)研究三峡库区水体和底泥中PAHs和PAEs可能的来源.采用IBM SPSS Statistics 20软件进行主成分分析.
2 结果与讨论 2.1 水体和底泥中PAHs的分布及来源 2.1.1 PAHs的分布从表 1可以看出,2016年三峡库区水体中ΣPAHs浓度范围为3.9~107.6 ng/L(均值为39.9 ng/L),低于2011年(范围为18~159 ng/L,均值为44.1 ng/L)[12],以及2012年(范围为131~228 ng/L,均值为155 ng/L)[14].水体中ΣPAHs平均浓度在支流高于干流,且干流和支流均为放水期高于蓄水期. 2016年三峡库区底泥中ΣPAHs含量范围为267.9~1018.1 ng/g(均值为490.9 ng/g),远低于2005年长江武汉段底泥中ΣPAHs含量均值(1334.5 ng/g)[20],高于2010-2011年长江口底泥中ΣPAHs含量(128.5~307.8 ng/g)[7].干流和支流底泥中ΣPAHs平均含量差异不大.干流中底泥ΣPAHs平均含量在蓄水期高于放水期,可能是由于蓄水期水体中PAHs的沉淀作用所致[12].
| 表 1 三峡库区水体和底泥中的ΣPAHs分布 Tab.1 ΣPAHs in water and sediment from the TGR |
16种PAHs可根据含有的苯环数量被划分为2~3环、4环和5~6环,分别代表低分子、中分子和高分子PAHs[21].放水期水体中主要的PAH单体是2~3环,蓄水期为2~3环和4环.不论蓄水期还是放水期,Nap均为水体中浓度最高的PAH.长江干流武汉段水体中主要的PAH单体为2~3环和4环[20],与三峡库区较相似.各采样断面检出的BaP含量范围为0~0.64 ng/L,未超过我国《地表水环境质量标准》限值2.8 ng/L[10].底泥中,放水期比蓄水期PAH单体浓度变化幅度大,PAH单体除了Phe含量较高外,其余均以4环和5~6环为主(图 2).综合分析,三峡库区水体中PAH以2~3环和4环为主,底泥中以4环和5~6环为主,可能是因为环数较小的PAHs溶解度较大,不容易沉积到底部;而环数大的PAHs疏水性强,更容易被底泥吸附.

|
图 2 2016年6月和12月三峡库区水体(a和b)和底泥(c和d)中16种PAH单体分布 Fig.2 Distribution of 16 PAH monomers in water (a, b) and sediment (c, d) of the TGR in June and December of 2016 |
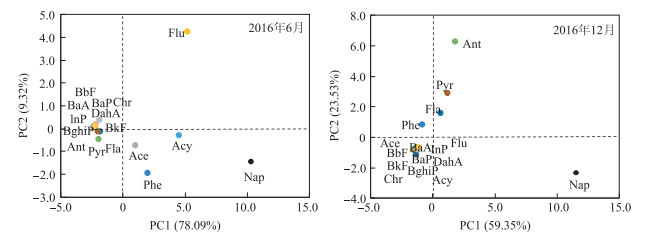
辨识水体和底泥中PAHs的来源对于水质管理十分重要.主成分分析常被用于分析PAHs的来源[7, 22].三峡库区水体中的PAHs共提取了3种主成分(PC),主成分的提取以特征根大于1为标准.由于6月和12月水样中PC3的方差贡献率较低,分别仅为6.10 %和9.52 %,而PC1和PC2的累积方差分别达到了87.41 %和82.88 %,可以代表水体和底泥中PAHs的大多数信息(图 3).因此图 3中未展示PC3的结果,仅显示PC1和PC2的结果.底泥样品在6和12月均只提取出1个主成分,PC1的方差贡献率分别达到88.90 %和86.28 %.

|
图 3 2016年6月和12月三峡库区水体中16种PAHs的主成分分析 Fig.3 Rotated principal components of 16 PAHs in water of the TGR in June and December of 2016 |
水体中Nap在两个水期均为PC1的主要贡献者. Flu和Ant分别是放水期和蓄水期样品中PC2的主要贡献者(图 3).由于Nap是焦化或煤焦油挥发的特征标志物[22],通常代表大气传输[23]. Nap、Flu和Ant均为2~3环的PAHs,通常来自石油源及燃料的中低温燃烧[23].因此,水体中PAHs的主要来源是焦化或煤焦油挥发、石油源及燃料的中低温燃烧. 6月底泥中Phe对PC1的贡献率最高,12月以Fla贡献率最高. Phe与煤和生物质燃烧排放有关,同时与原油和石油的泄漏有关[7],这表明6月底泥中PC1主要贡献为煤和生物质燃烧以及石油. Fla主要来源于工业燃煤和民用燃煤[23].因此,三峡库区底泥中PAHs主要的来源为煤和生物质燃烧以及石油.
2.2 水体和底泥中PAEs的分布及来源 2.2.1 PAEs的分布三峡库区18个采样点中均检测到PAEs,说明PAEs在三峡库区广泛存在.水体中ΣPAEs浓度范围为122.4~2884.7 ng/L (均值为848.1 ng/L),低于长江武汉段(范围为34~91220 ng/L,均值为23613 ng/L)[24]以及长江口(范围为61~28550 ng/L,均值为4536 ng/L)[22].干流与支流水体中ΣPAEs平均浓度差异不大.干流水体中ΣPAEs的平均浓度在蓄水期显著高于放水期,可能是蓄水期干流水体流速慢、自净能力弱造成的[24].支流水体中ΣPAEs浓度在蓄水期和放水期无显著差异,但放水期水体ΣPAEs浓度变化幅度大于蓄水期,可能与外源污染物的汇入有关.三峡库区底泥中ΣPAE浓度范围在放水期和蓄水期份别为436.9~3127.7 ng/g(均值为1800.4 ng/g)和192.9~3473.4 ng/g(均值为706.3 ng/g),显著低于长江武汉段(76300~450000 ng/g)[24].同时,各PAE单体浓度也显著低于广州城市某湖泊底泥中各PAHE单体浓度[25].底泥中ΣPAEs平均浓度在干流高于支流,放水期显著高于蓄水期(表 2).
| 表 2 三峡库区水体和底泥中ΣPAEs分布 Tab.2 Distribution of ΣPAEs in water and sediment of the TGR |
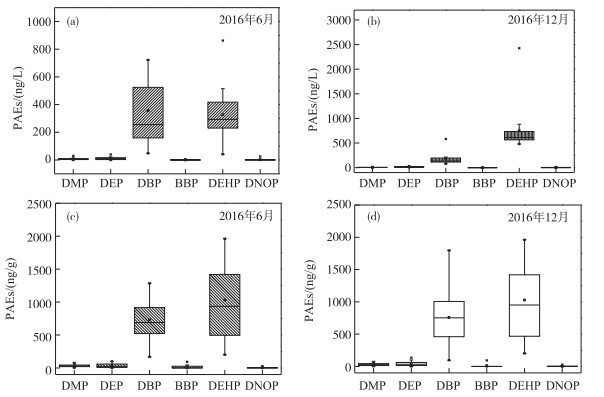
三峡库区水体中DEHP和DBP是主要污染物,浓度范围分别为41.0~2425.6和75.6~722.5 ng/L.所有采样点水体中DEHP和DBP浓度均低于国家《地表水环境质量标准》的限值(8000和3000 ng/L)[10].底泥中主要污染物仍然为DEHP和DBP,含量分别为201.8~3278.46和35.6~1796.3 ng/g.不论是水体还是底泥,DEHP均为浓度最高的PAE类污染物(图 4).

|
图 4 2016年6月和12月三峡库区水体(a和b)和底泥(c和d)中6种PAE单体分布 Fig.4 Distribution of 6 PAE monomers in water (a, b) and sediment (c, d) of the TGR in June and December of 2016 |
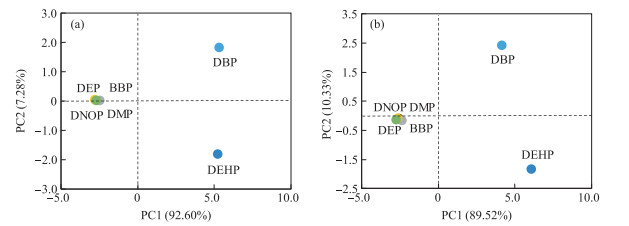
采用主成分分析法来分析三峡库区水体和底泥中PAEs的来源,结果如图 5所示.对于6月水体和底泥样品,均提取出2个主成分,每个主成分的特征根均大于1. 6月水体样品前两个主成分的方差贡献率分别为92.60 %和7.28 %,底泥样品分别为89.52 %和10.33 %.对于12月的水体和底泥样品,均提取出1个主成分,PC1的方差贡献率分别达到97.63 %和96.94 %.

|
图 5 2016年6月三峡库区水体(a)和底泥(b)中6种PAE的主成分分析 Fig.5 Rotated principal components of 6 PAEs in water (a) and sediment (b) of the TGR in June of 2016 |
6月水体样品PC1中DBP和DEHP载荷最高,PC2中DBP载荷最高;12月水体样品PC1中DEHP载荷最高. 6月底泥PC1中DEHP和DBP载荷最高,PC2中DBP载荷最高;12月底泥样品PC1中DEHP载荷最高.总体而言,水体和底泥样品中,载荷最高的均为DEHP,其次为DBP(图 5). DEHP主要来源于塑料和重化工产业,同时也是家庭垃圾滤出液中主要的PAE类污染物[22]. DBP被广泛应用于化妆品和个人护理品中[25],是生活垃圾中的主要PAE类污染物[26].可见,三峡库区水体和底泥中PAEs的主要来源于塑料和重化工工业以及生活垃圾.
| [1] |
Liu S, Xia X, Zhai Y et al. Black carbon (BC) in urban and surrounding rural soils of Beijing, China:Spatial distribution and relationship with polycyclic aromatic hydrocarbons (PAHs). Chemosphere, 2011, 82(2): 223-228. DOI:10.1016/j.chemosphere.2010.10.017 |
| [2] |
Deyerling D, Wang J, Hu W et al. PAH distribution and mass fluxes in the Three Gorges Reservoir after impoundment of the Three Gorges Dam. Science of the Total Environment, 2014, 491/492: 123-130. DOI:10.1016/j.scitotenv.2014.03.076 |
| [3] |
Li B, Liu R, Gao H et al. Spatial distribution and ecological risk assessment of phthalic acid esters and phenols in surface sediment from urban rivers in Northeast China. Environmental Pollution, 2016, 219: 409. DOI:10.1016/j.envpol.2016.05.022 |
| [4] |
Liu X, Shi J, Bo T et al. Occurrence and risk assessment of selected phthalates in drinking water from waterworks in China. Environ Sci Pollut Res, 2015, 22(14): 10690-10698. DOI:10.1007/s11356-015-4253-9 |
| [5] |
Net S, Sempéré R, Delmont A et al. Occurrence, fate, behavior and ecotoxicological state of phthalates in different environmental matrices. Environmental Science & Technology, 2015, 49(7): 4019. DOI:10.1021/es505233b |
| [6] |
Xu X, Tan Y, Yang G. Environmental impact assessments of the Three Gorges Project in China:Issues and interventions. Earth-Science Reviews, 2013, 124: 115-125. DOI:10.1016/j.earscirev.2013.05.007 |
| [7] |
Wang Y, Shen C, Shen Z et al. Spatial variation and sources of polycyclic aromatic hydrocarbons (PAHs) in surface sediments from the Yangtze Estuary, China. Environmental Science Processes & Impacts, 2015, 17(7): 1340-1347. DOI:10.1039/c5em00077g |
| [8] |
Zhang L, Liu J, Liu H et al. The occurrence and ecological risk assessment of phthalate esters (PAEs) in urban aquatic environments of China. Ecotoxicology, 2015, 24(5): 967-984. DOI:10.1007/s10646-015-1446-4 |
| [9] |
Xu Z, Zhang W, Lv L et al. A new approach to catalytic degradation of dimethyl phthlate by a macroporous OH-type strongly basic anion exchange resin. Environmental Science & Technology, 2010, 44(8): 3130-3135. DOI:10.1021/es100058j |
| [10] |
GB 3838-2002. State Environmental Protection Administration of China:Environmental Quality Standard for Surface Water, 2002. [GB 3838-2002. 中华人民共和国地表水环境质量标准, 2002. ]
|
| [11] |
Zhang K, Xiong X, Hu H et al. Occurrence and characteristics of microplastic pollution in Xiangxi Bay of Three Gorges Reservoir, China. Environmental Science & Technology, 2017, 51(7): 3794-3801. DOI:10.1021/acs.est.7b00369 |
| [12] |
Wang J, Henkelmann B, Bi Y. Temporal variation and spatial distribution of PAH in water of Three Gorges Reservoir during the complete impoundment period. Environ. Sci Pollut Res, 2013, 20(10): 7071-7079. DOI:10.1007/s11356-012-1427-6 |
| [13] |
Floehr T, Scholz-starke B, Xiao H et al. Yangtze Three Gorges Reservoir, China:A holistic assessment of organic pollution, mutagenic effects of sediments and genotoxic impacts on fish. J Environ Sci, 2015, 38: 63-82. DOI:10.1016/j.jes.2015.07.013 |
| [14] |
Zhu Y, Yang Y, Liu M et al. Concentration, Distribution, source, and risk assessment of pahs and heavy metals in surface water from the Three Gorges Reservoir, China. Hum Ecol Risk Assess A, 2015, 21(6): 1593-1607. DOI:10.1080/10807039.2014.962315 |
| [15] |
Tao YQ, Yao SC, Xue B et al. Polycyclic aromatic hydrocarbons in surface sediments from drinking water sources of Taihu Lake, China:sources, partitioning and toxicological risk. J Environ Monit, 2010, 12(12): 2282-2289. DOI:10.1039/c0em00144a |
| [16] |
Li SY, Tao YQ, Yao SC et al. Distribution, sources, and risks of polycyclic aromatic hydrocarbons in the surface sediments from 28 lakes in the middle and lower reaches of the Yangtze River region, China. Environ Sci Pollut R, 2016, 23(5): 4812-4825. DOI:10.1007/s11356-015-5705-y |
| [17] |
Xu C, Shu WQ, Luo CH et al. Water environmental health risk assessment of PAHs and PAEs in the Three Gorges Reservoir. Res Environ Sci, 2007, 20(5): 57-60. [许川, 舒为群, 罗财红等. 三峡库区水环境多环芳烃和邻苯二甲酸酯类有机污染物健康风险评价. 环境科学研究, 2007, 20(5): 57-60.] |
| [18] |
Limam I, Driss MR. Off-line solid-phase extraction procedure for the determination of polycyclic aromatic hydrocarbons from aqueous matrices. Int J Environ Sci Technol, 2013, 10(5): 973-982. DOI:10.1007/s13762-013-0229-9 |
| [19] |
Brown JN, Peake BM. Determination of colloidally-associated polycyclic aromatic hydrocarbons (PAHs) in fresh water using C18 solid phase extraction disks. Anal Chim Acta, 2003, 486(2): 159-169. DOI:10.1016/S0003-2670(03)00472-0 |
| [20] |
Feng C, Xia X, Shen Z. Distribution and sources of polycyclic aromatic hydrocarbons in Wuhan section of the Yangtze River, China. Environ. Monit Assess, 2007, 133(1/2/3): 447-458. DOI:10.1007/s10661-006-9599-5 |
| [21] |
Amoako J, Ansa-Asare OD, Karikari AY et al. Levels of polycyclic aromatic hydrocarbons (PAHs) in the Densu River Basin of Ghana. Environ Monit Assess, 2011, 174(1/2/3/4): 471-480. DOI:10.1007/s10661-010-1471-y |
| [22] |
Zhang L, Dong L, Ren L et al. Concentration and source identification of polycyclic aromatic hydrocarbons and phthalic acid esters in the surface water of the Yangtze River Delta, China. J Environ Sci, 2012, 24(2): 335-342. DOI:10.1016/S1001-0742(11)60782-1 |
| [23] |
Chen F, Meng FS, Wang YY. The research of polycyclic aromatic hydrocarbons in the river based on the principal component-multivariate linear regression analysis. Environmental Monitoring in China, 2016, 32(4): 49-53. [陈峰, 孟凡生, 王业耀等. 基于主成分分析-多元线性回归的松花江水体中多环芳烃源解析. 中国环境监测, 2016, 32(4): 49-53.] |
| [24] |
Wang F, Xia X, Sha Y. Distribution of Phthalic Acid Esters in Wuhan section of the Yangtze River, China. J Hazard Mater, 2008, 154: 317-324. DOI:10.1016/j.jhazmat.2007.10.028 |
| [25] |
Zeng F, Cui K, Xie Z et al. Occurrence of phthalate esters in water and sediment of urban lakes in a subtropical city, Guangzhou, South China. Environ Int, 2008, 34(3): 372-380. DOI:10.1016/j.envint.2007.09.002 |
| [26] |
Koniecki D, Wang R, Moody RP et al. Phthalates in cosmetic and personal care products:Concentrations and possible dermal exposure. Environ Res, 2011, 111(3): 329-336. DOI:10.1016/j.envres.2011.01.013 |
 2018, Vol. 30

