(2: 南京信息工程大学无锡研究院, 无锡 214000)
(3: 南京信息工程大学滨江学院, 无锡 214000)
(4: 南京信息工程大学气象灾害预报预警与评估协同创新中心/江苏省农业气象重点实验室, 南京 210044)
(2: NUIST-Wuxi Research Institute, Wuxi 214000, P. R. China)
(3: Binjiang College of NUIST, Wuxi 214000, P. R. China)
(4: Collaborative Innovation Center on Forecast and Evaluation of Meteorological Disasters/Jiangsu Key Laboratory of Agricultural Meteorology, Nanjing University of Information Science and Technology, Nanjing 210044, P. R. China)
湖泊在局地能量收支、水分循环、流域天气和气候变化中扮演着重要角色[1-3].与其他下垫面相比,湖泊的反照率低、热容量大、粗糙度小[4],其存在会减小感热通量、增加潜热通量,从而改变局地的能量收支和分配特征[5].作为湖泊生物物理和生物化学过程的驱动力,湖面能量收支和分配特征的改变会对流域天气和气候产生重要影响.比如湖泊蒸发会增加局地大气水汽含量[6],引发下游强降水[7-9];湖面感热通量通过改变水陆热力差异影响局地环流(如湖陆风)[10];热容量较大的湖泊对流域气温变化具有缓冲作用,夏季降温、冬季增温[11].湖泊与大气之间的感热和潜热交换是湖泊能量平衡的重要组分,感热与潜热的比值(即波文比)反映湖面的能量分配特征.感热能够表征湖泊对大气的加热强度,直接体现湖泊的热力特性[12];潜热作为湖泊能量支出的主要方式,是联系湖泊能量平衡与水分循环的纽带[13-14].因此,观测和分析湖泊与大气之间的水热交换对研究湖泊在流域天气、气候和水循环中的贡献至关重要.
天气系统过境带来的气团性质改变会影响湖泊水热交换过程[15],冷空气作为冷季最主要的天气事件,对湖泊水热通量有显著的增强作用[16-17].理论上,湖泊与大气之间的水热交换取决于水-气界面的湿度差/温度差和湍流交换强度[18-19].相较于空气,湖面温度及其对应的饱和水汽压变化缓慢,使得湖泊与大气之间的水热交换主要取决于空气温度、湿度、风速和湍流交换强度.因此,大陆性冷空气过境带来的干冷气团和风速增大会引起湖泊水热交换突增,这一现象被湖泊通量观测所证实[20]. Liu等[21]基于涡度相关观测发现,冷锋过境期间,美国Ross Barnett水库的潜热和感热通量分别增至无冷锋时的7.3和2.7倍;Curtarelli等[22]基于物质传输方程通过MODIS数据反演得到,冷锋过境使得巴西Itumbiara水库的潜热和感热通量分别增加了19 %和24 %.在时间序列上,冷锋过境引起的湖泊感热和潜热通量增加如同“脉冲”事件[23],即较强的湖泊水热交换在短时间内完成. Blanken等[24]基于Great Slave Lake的涡度相关观测发现,1997-1999年“脉冲”事件对应的潜热通量分别占全年蒸发的45 %、65 %和47 %.在Ross Barnett水库,“脉冲”事件对应的潜热和感热通量分别占全年总量的28 %和50 % [25].不同强度冷空气引起的气温下降、湿度变化、风速增大和湍流交换增强均不相同,依据物质传输原理[26],其引发的湖泊水热通量增强也不尽相同.然而,目前尚未有研究量化冷空气强度对湖泊水热通量的影响.
太湖是我国第三大淡水湖泊,水域面积为2338 km2,平均水深为1.9 m[27].太湖地处长江三角洲南缘,冷空气过境主要集中在11月至翌年3月,路径主要以中路(自西西伯利亚和蒙古进入我国,经河套地区到达太湖)为主[28],性质主要为大陆性干冷气团.本文基于2012年11月-2017年3月太湖中尺度通量网的观测数据[29],统计了5年间影响太湖的不同强度冷空气的发生频次及其对应的气象条件特征,量化了冷空气事件强度对太湖水热通量的影响,探讨了不同湖泊的水热通量对冷空气事件的响应差异,以期为预测未来极端冷空气事件对太湖水热交换的影响提供科学依据.
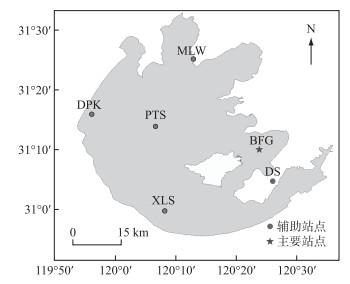
1 数据与分析 1.1 太湖通量和气象要素观测本文所使用的通量和气象数据来自于太湖中尺度通量网的避风港站(31.1685°N, 120.3972°E, 简称BFG).此外,太湖中尺度通量网还包含以下4个湖泊站点:梅梁湾站(31.4197°N, 120.2139°E, 简称MLW)、大浦口站(31.2661°N, 119.9312°E, 简称DPK)、小雷山站(30.9972°N, 120.1344°E, 简称XLS)和平台山站(31.2323°N, 120.1086°E, 简称PTS),其具体地理位置如图 1所示.若BFG站气象观测数据缺失,则通过其他站点的观测数据进行平行插补(1.3.2节).

|
图 1 太湖中尺度通量网各站点示意 Fig.1 Distribution of each site of Taihu Eddy Flux Network |
BFG站四周水面开阔,离岸最近的直线距离为4 km,是理想的湖泊观测站点. BFG站的观测包括涡度相关观测和气象观测.涡度相关系统由三维超声风速计(型号CSAT-3, Campbell scientific Inc., Logan, Utah)和开路式CO2/H2O红外气体分析仪(型号EC150, Campbell scientific Inc., Logan, Utah)组成.基于三维风速、超声虚温、水汽密度和CO2密度的10 Hz观测值,利用数据采集器(型号CR3000, Campbell scientific Inc., Logan, Utah)在线计算半小时平均的动量通量、感热通量、潜热通量和CO2通量.气象要素观测包括空气温度、空气湿度(型号HMP155A, Vaisala Inc., Helsinki, Finland)、风速风向(型号05103, R.M. Young Company, Traverse City, Michigan)、降水量(型号TE525-L, Campbell Scientific Inc., Logan, Utah)和大气压强(型号PTB110, Vaisala Inc., Helsinki, Finland).向下短波、向下长波、向上短波和向上长波辐射由四源净辐射传感器(型号CNR4, Kipp & Zonen B.V., Delft, the Netherlands)测得.气象要素和辐射分量均以1 Hz的频率采集(型号CR1000, Campbell scientific Inc., Logan, Utah),并在线计算半小时平均值.
1.2 辅助数据来源本文利用日最低气温来划分冷空气事件强度,该数据来源于东山气象站(31.0799°N,120.4346°E,简称DS). DS站位于江苏省苏州市东山镇吴巷山村,为国家基本气象观测站(站号58346),该站离岸最近距离约1.5 km,是距BFG站最近的国家气象观测站(图 1).
1.3 数据处理 1.3.1 数据筛选本文选用BFG站2012-2017年冷季(11月至翌年3月,月平均气温低于15℃)的半小时观测数据(共25个月).根据仪器工作状态和试验日志剔除气象和通量观测数据中的异常值.水热通量数据需要进行以下后处理:两次坐标旋转[30]、超声虚温订正和密度效应校正[31].经过数据预处理、后处理和质量控制后,各个要素的有效数据占比如表 1所示.
| 表 1 数据预处理、后处理和质量控制后有效数据占总数据的比例 Tab. 1 The proportions of post- processing data to total data |
对气象数据和通量数据采取不同的插补方法.对缺失较少(一天内不超过5个)的气象数据(风速和短波辐射除外)和通量数据进行线性内插.对较大的数据空缺,气象数据和通量数据分别进行插补.首先,分别建立BFG站与DPK、MLW、PTS、XLS站点的气象数据的线性关系(相关系数r > 0.80,P < 0.05),选择相关性最好的辅助站点,通过两个站点的线性关系将BFG站缺失的气象数据插补完整.其次,在半小时尺度上,利用物质传输方程插补缺失的感热通量(H)和潜热通量(LE)[32].
| $ L E=\rho_{\mathrm{a}} \cdot L_{\mathrm{v}} \cdot C_{\mathrm{E}} \cdot u\left(q_{s}-q_{\mathrm{a}}\right) $ | (1) |
| $ H=\rho_{\mathrm{a}} \cdot c_{\mathrm{p}} \cdot C_{\mathrm{H}} \cdot u\left(T_{\mathrm{w}}-T_{\mathrm{a}}\right) $ | (2) |
式中,ρa为空气密度(kg/m3),Lv为汽化潜热(2.48×106 J/kg),CE和CH分别为潜热和感热传输系数,cp为空气定压比热(1004.64 J/(kg ·K)),qs为水面温度对应的饱和比湿(kg/kg),qa为空气比湿(kg/kg),Tw为水面温度(K),Ta为气温(K).基于斯蒂芬-玻尔兹曼定律,由长波辐射观测数据计算水面温度Tw, 即:
| $ T_{\mathrm{w}}=\left[\frac{L_{1}-(1-\varepsilon) L_{\downarrow}}{\sigma \cdot \varepsilon}\right]^{1 / 4} $ | (3) |
式中,ε为水面比辐射率(0.96),σ为斯蒂芬-玻尔兹曼常数(5.669×10⁻⁸W/(m2 ·K4)).
根据物质传输理论,分四季建立水面与大气之间的湿度梯度(qs-qa)与潜热通量、温度梯度(Tw-Ta)与感热通量的线性关系(r>0.85,P < 0.05),根据该线性关系,可以基于完整的气象数据插补通量数据.
1.4 冷空气强度的划分本文以2017年中国国家标准化管理委员会发布的冷空气等级为标准[33],依据东山气象站(数据来源于中国气象数据网www.data.cma.cn)的日最低气温、24小时内降温幅度、48小时内降温幅度和72小时内降温幅度,将冷空气事件分为四个等级:寒潮、强冷空气事件、较强冷空气事件和弱冷空气事件(表 2).
| 表 2 冷空气事件分类标准(改自冷空气等级[33]) Tab. 2 The classification standards of cold air events (adapted by Grade of Cold Air [33]) |
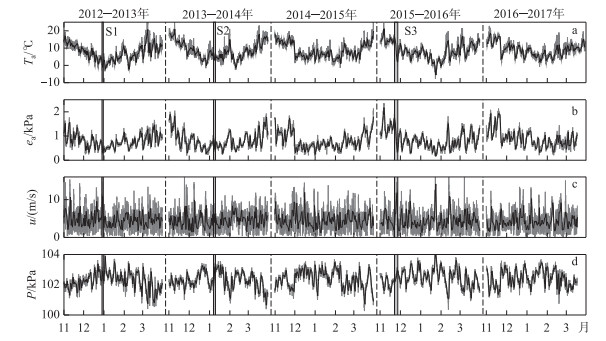
太湖2012-2017年冷季气象要素和能量通量的时间变化特征如图 2~4所示,冷季均值如表 3所示.在太湖,11月和12月为气温下降期,1月和2月为气温波动期,3月为气温上升期. 2012-2017年太湖冷季平均气温从7.4℃升至9.0℃,1月和2月上升更明显,增幅为2.8℃.水汽压在冷季内的变化趋势与气温一致,最大值和最小值分别出现在11月(1.13 kPa)和1月(0.62 kPa).冷季平均水汽压在冷季间明显上升,从0.80 kPa升至0.90 kPa.风速在冷季各月份之间无明显的变化趋势,冷季平均值在5个冷季间下降了0.2 m/s. 2012-2013年冷季和2013-2014年冷季平均风速大于其他冷季,这主要与这两个冷季大风天气(> 8 m/s,即大于95 %分位点的风速)频发有关,分别出现了9次和7次.

|
图 2 2012-2017年冷季气象要素日均值(黑线)和半小时均值(灰线)的时间序列图 (a:空气温度;b:大气水汽压;c:风速;d:大气压强; S1、S2和S3分别代表 1次典型的较强冷空气、强冷空气和寒潮) Fig.2 Time series of daily mean (black line) and half-hour mean (gray line) of meteorological elements in cool seasons from 2012 to 2017 (a, air temperature; b, atmospheric vapor pressure; c, wind speed; d, atmospheric pressure; S1, S2 and S3 represent a typical strong cold air event, serve cold air event and cold wave) |

|
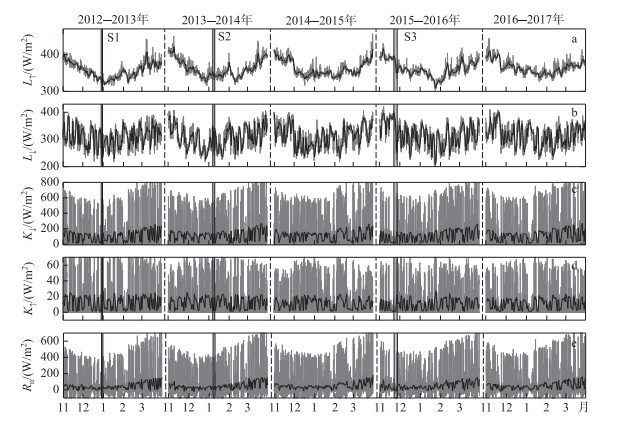
图 3 2012-2017年冷季辐射分量的日均值(黑线)和半小时均值(灰线)的时间序列图 (a:向上长波辐射, b:向下长波辐射, c:向下短波辐射, d:向上短波辐射, e:净辐射; S1、S2和S3的含义同图 2) Fig.3 Time series of daily mean (black line) and half-hour mean (gray line) of radiation components in cool seasons from 2012 to 2017 (a: upward longwave; b: downward longwave; c: upward shortwave; d: downward shortwave; e: net radiation; The meanings of S1, S2 and S3 are as same as the description in Fig. 2) |

|
图 4 2012-2017年冷季水热通量的日均值(黑线)和半小时均值(灰线)的时间序列图 (a:潜热通量, b:感热通量; S1、S2和S3含义同图 2) Fig.4 Time series of daily mean (black line) and half-hour mean (gray line) of latent heat and sensible heat fluxes in cool seasons from 2012 to 2017 (a: latent heat flux; b: sensible heat flux; The meanings of S1, S2 and S3 are as same as the description in Fig. 2) |
| 表 3 2012-2017年冷季气象要素和水热通量的平均值 Tab. 3 The average values of meteorological elements, latent heat and sensible fluxes in the cool seasons from 2012 to 2017 |
如图 3和表 3所示,辐射分量的季节和年际变化特征不同.在冷季内,长波辐射与气温的变化趋势一致,在11-12月下降,1-2月波动,3月上升. 5个冷季间,L↓增加了6 W/m2,L↑增加了9 W/m2. K↓在11-12月减小,在1-3月增加,但无明显的年际变化趋势,冷季平均最大值和最小值分别为116.5和104.7 W/m2. K↑的季节变化特征不明显,5个冷季间呈波动式减少,从2012-2013年冷季至2016-2017年冷季减少了1.7 W/m2.太湖净辐射Rn在12月最低(26.5 W/m2),3月最高(84.1 W/m2),其年际变化主要受K↓控制,在波动中上升了6 W/m2.
太湖冷季感热通量在各月间波动较大,无明显的变化规律,最大值和最小值分别出现在11月(8.0 W/m2)和1月(5.7 W/m2).冷季平均感热通量在5个冷季间呈减少趋势,从8.6 W/m2减少至7.3 W/m2. LE在11-12月下降,1月份降至最低(16.3 W/m2),1-3月上升,3月升至32.2 W/m2,且年际间呈上升趋势,5个冷季增幅为1.5 W/m2.虽然2015-2016年冷季与2014-2015年冷季的气象要素差异较小,但2015-2016年冷季的感热和潜热通量分别比2014-2015年冷季高2.1和7.3 W/m2.可见,太湖冷季平均水热通量的年际变化并非完全取决于气象要素的年际波动.
根据冷空气等级划分标准,从2012-2017年冷季中共筛选出48次冷空气事件(表 4),包括寒潮、强冷空气和较强冷空气,因弱冷空气强度低,并未进行统计.如表 4所示,5个冷季间冷空气事件发生频次和天数占比呈减少趋势,其中,寒潮和强冷空气发生频次呈波动特征,较强冷空气发生频次减少. 5个冷季间,冷空气事件发生次数(天数占比)从2012-2013年冷季的15次(26 %)降至2016-2017年冷季的7次(11 %). 2014-2017年3个冷季各发生1次、2次和1次寒潮,每次寒潮的平均持续天数为3.5天.强冷空气在2012-2017年冷季分别发生了5、2、1、1和2次,平均持续3天. 5个冷季间,较强冷空气发生次数依次为10、5、7、7和4次,平均持续2.4天.可见,随着冷空气强度增加,其发生频次减少,持续时间延长.
| 表 4 2012-2017年冷季期间不同强度冷空气的发生频次和持续天数* Tab. 4 Frequencies and durations of different cold air events in the cool seasons from 2012 to 2017 |
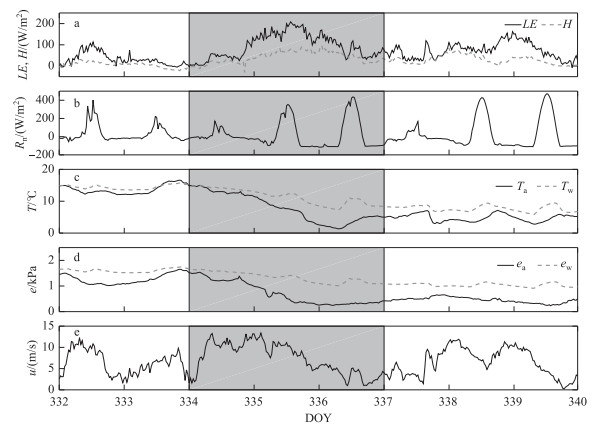
冷空气过境时,太湖的气象要素和能量通量的时间变化特征一致.以2014年11月30日过境的一次强冷空气事件为例,分析其对太湖气象要素和能量通量时间变化特征的影响(图 5).本次强冷空气事件可分为3个时间段:冷空气过境前(第332~333日)、冷空气过境期间(第334~336日)和冷空气过境后(第337~339日).在强冷空气过境前,太湖地区的气温(Ta)、水面温度(Tw)在10~15℃上下波动;冷空气过境时,Ta和Tw分别下降了10℃和5℃,大气与水面之间的温度差增至5℃.温度从第336日开始回升,最终稳定在3~4℃左右,比冷空气入侵前下降了10℃,由于气温上升幅度大于水面温度,则水气界面的温度梯度减小.强冷空气过境时的水汽压时间变化特征与气温一致,过境期间,大气水汽压(ea)和水面饱和水汽压(ew)分别减小了1 kPa和0.5 kPa左右,水气界面的水汽压梯度增加了0.5 kPa,且水汽压在冷空气过境后未立即回升,比气温回升滞后1天左右.强冷空气过境期间风速明显增大,半小时风速增至13 m/s左右,自第336日开始减小.

|
图 5 2014年11月30日一次强冷空气事件中(阴影部分)太湖气象要素和水热通量的时间变化 Fig.5 Time series of meteorological elements, latent heat and sensible heat fluxes during a serve cold air event on 2014-11-30 |
随着气象条件的改变,太湖与大气之间的能量通量受到不同程度的影响.本次强冷空气过境前,天气以阴天为主,净辐射(Rn)小于200 W/m2.冷空气影响期间有一段晴好天气,Rn升至400 W/m2.本次强冷空气过境前(第332~333日),LE和H的日最高值分别在70~100和10~20 W/m2之间波动.受水汽界面温度梯度增大、水汽压梯度增大和风速增加的共同影响,H和LE从第334日开始迅速增加,在第335日达到峰值,分别为200和80 W/m2.冷空气过境后开始回落,在第337日降至冷空气过境前水平.
2.3 3种强度冷空气过境时太湖的气象要素和水热通量对比在太湖,尽管各类冷空气引起的气象要素和水热通量的时间变化趋势一致,但由于气团性质和强度的差异,不同强度冷空气对局地气象条件和水热通量的影响程度存在差别. 表 5对比了日尺度上不同强度冷空气影响下与无冷空气时的气象要素均值.由表 5可知,随着冷空气强度增加,Ta明显下降.从无冷空气时的8.6℃降至寒潮时的6.9℃,当强度达到强冷空气时,气温降幅减小,与寒潮时均值仅差0.6℃.冷空气期间气温的标准差均在4.6℃左右,气温波动没有明显加剧.无冷空气时的ea为0.85 kPa,冷空气过境时ea明显减小. ea均值在不同强度冷空气之间差异不明显,寒潮天气时ea略高,为0.79 kPa. ea标准差的最低和最高值分别出现在强冷空气(0.31 kPa)和寒潮(0.42 kPa)影响时.冷空气期间的相对湿度(RH)明显低于无冷空气时的结果,随着冷空气强度增加,RH逐渐升至72.7 %,其波动规律与ea一致.冷空气入侵伴随着风速的增大,以寒潮时最为显著,平均风速可达7.7 m/s,且风速变化最为剧烈,标准差为2.7 m/s.大气压P在冷空气期间上升了0.2 kPa,但标准差无明显变化.
与无冷气时相比,冷空气过境时K↓的均值和标准差均显著下降,以寒潮时最为明显,均值下降了30 W/m2,标准差降低了40 %.除寒潮时K↑下降了3 W/m2外,其他冷空气期间K↑较无冷空气时均有上升.冷空气期间L↓降幅可达12 W/m2,随着冷空气强度增加,L↓有所回升,寒潮时可达313.6 W/m2.强冷空气和较强冷空气时L↑分别比无冷空气时的结果低6和4 W/m2,寒潮期间L↑最大,为365.2 W/m2.总体而言,除寒潮时长波辐射高于无冷空气时结果外,其他冷空气事件期间长波辐射都比无冷空气时低5~13 W/m2,这可能与寒潮期间空气湿度较大和云量较多有关.主要受入射短波辐射下降的影响,Rn在冷空气影响下显著低于无冷空气时的数值,寒潮、强冷空气和较强冷空气过境时的Rn均值分别为20.8、47.3和37.6 W/m2,比无冷空气时分别低29.3、3.0和22.7 W/m2(表 5).
| 表 5 3种强度冷空气期间与无冷空气时的气象要素和辐射分量对比 Tab. 5 Meteorological elements and radiation components of different cold air events and no-cold days |
不同强度冷空气过境导致的气象条件改变程度不同,对湖泊水热通量的影响也不同.如表 6所示,寒潮、强冷空气、较强冷空气和无冷空气时的感热通量H分别为44.4、25.9、18.8和4.3 W/m2.感热通量随着冷空气强度增大而增加,寒潮期间的感热通量约为无冷空气时的10倍.潜热通量在有无冷空气过境时差异显著,但不随着冷空气强度增大而线性增加,寒潮期间的LE最大(93.9 W/m2),较强冷空气期间结果次之(64.1 W/m2).尽管寒潮过境时太湖与大气之间的水热通量最大,但因持续天数少(14天),其感热和潜热通量占5个冷季总感热和潜热通量的比例分别为11.0 %和5.8 %,与强冷空气时的结果相当.在所有冷空气事件中,较强冷空气因持续日数最长,其影响期间的水热通量对太湖总水热通量贡献最大,约为25 %.虽然冷空气影响的天数占比仅为16.4 %,但对冷季的感热和潜热通量的贡献分别高达51.7 %和34.9 %.可见,冷空气过境时,太湖与大气之间的水热交换在更短的时间内迅速完成,并且冷空气对太湖水热通量的贡献不仅取决于冷空气强度,还受其发生频次和持续时间影响.
| 表 6 3种强度冷空气期间与无冷空气时的水热通量对比 Tab. 6 Latent heat and sensible heat fluxes of different cold air events and no-cold days |
在2012-2017年冷季中,太湖的气象要素和水热通量存在显著的年际变化特征.气温和水汽压逐年上升,风速略有下降,这与Zhang等[34]对太湖25年的气象要素观测结果相同.向下短波和向下长波辐射增加,共同导致太湖水面的净辐射增加,这与陈桥等[35]和商兆堂等[36]对太湖辐射年际变化的研究结果一致. 5个冷季间太湖与大气之间的感热通量在波动中下降了1.6 W/m2,潜热通量上升了1.5 W/m2,这与王伟[37]的预测趋势一致.可见,在未来气候变暖情景下,波文比随着气温上升而减小[38],湖泊更多的可利用能量(净辐射减去热储量)将用于蒸发,能量再分配特征的改变将促进亚热带大型浅水湖泊蒸发.
冷空气入侵作为冷季最主要的天气事件,其发生频次、强度和持续时间的变化,都会增加水热通量的年际变化[25].以2015-2016年冷季为例,虽然该季的气象要素与相邻年份的结果接近,但该季的平均水热通量明显高于相邻年份的观测结果,且波动更大,这是由于2015-2016年冷季的冷空气影响总天数占比大,且寒潮天数较多,由此带来的水热通量“脉冲”事件拉高了均值.本研究发现,5个冷季间影响太湖的冷空气事件总次数明显减少,但寒潮发生次数呈波动上升,这与气候变暖背景下近几十年中国冷空气的年际变化特征相同[39-41],今后需深入分析寒潮年际波动对太湖水热通量年际变化的贡献.
3.2 湖泊水热通量的主控因子和对冷空气的响应特征不同强度冷空气影响下的气象条件变化不同,对湖泊水热通量的影响程度也不同,由此可以明确在天气事件尺度上湖泊水热通量的主控因子.除降温幅度外,强冷空气与较强冷空气过境对气象要素的影响相近,而寒潮过境带来的空气更冷、湿度更大、风速更大,且阴雨天居多、净辐射更少,寒潮影响下的太湖水热通量增幅明显大于另外2种冷空气事件.由表 7可知,冷空气影响时的潜热通量与风速的相关性均强于与水汽压梯度的结果.而且,相较于无冷空气时,冷空气期间风速变化幅度(83 %),远高于水汽压的变化幅度(7 %)(表 5).在天气事件尺度上,太湖潜热通量的主控因子为风速,其他研究也发现湖泊潜热通量与风速的相关性更佳[19, 42-45]. 3种冷空气期间的感热通量与水气界面温度梯度的相关系数均明显大于风速.在天气事件尺度上,水气界面的温度梯度对太湖感热通量的影响较风速更大,这与其他湖泊通量研究结果一致[46-49].
| 表 7 3种强度冷空气期间太湖感热和潜热通量与气象要素的相关系数* Tab. 7 The correlation coefficients between sensible heat, latent heat fluxes and meteorological elements during three kinds of cold air events |
冷空气入侵会导致湖面与大气之间的温度梯度和湿度梯度增加、风速增大[50-51],进而加快湖泊与大气之间的水热交换[17].不同深度湖泊的热力结构特征不同[52],冷空气过境对水热通量的增加也因湖泊深度不同而存在差别(表 8).浅湖(平均深度≤6 m)因热储量较小,对天气事件的响应更快,冷空气期间的潜热和感热通量平均值分别是无冷空气时的2.7和8.6倍,而深湖的增加倍数分别为2.2和4.2.太湖(31°10′N)和Ross Barnett水库(32°26′N)同为亚热带浅水湖泊,太湖多年冷季平均H和LE分别为7.5和30.0 W/m2,而Ross Barnett水库冷季平均的H和LE约为太湖的2倍(17.5、61.3 W/m2).若选取相近的研究月份,Ross Barnett水库冷空气期间的H和LE分别是无冷空气时的5.4和2.1倍[25],与本文对太湖的研究结果接近.
| 表 8 不同研究中湖泊水热通量对冷空气的响应 Tab. 8 The responses of latent heat and sensible heat fluxes to cold air events in different researched lakes |
基于2012-2017年太湖中尺度通量网观测数据,统计了5个冷季期间影响太湖的寒潮、强冷空气和较强冷空气的发生频次、持续时间及其对应的气象条件特征,量化了冷空气强度对太湖水热通量的影响,结论如下:
1) 2012-2017年太湖共有48次冷空气过境,随着强度增加,冷空气发生频次减少(寒潮、强冷空气和较强冷空气分别为4、11、和33次),平均持续时间延长(寒潮、强冷空气和较强冷空气分别为14、31、和78天). 5个冷季间,太湖冷空气发生频次和天数占比分别减少了8次和15 %.
2) 冷空气过境明显增强太湖的水热通量,寒潮、强冷空气和较强冷空气期间,太湖的感热通量分别增至无冷空气时的10.3、6.0和4.3倍,潜热通量分别增至无冷空气时的4.0、2.1和2.7倍.
3) 冷空气对太湖水热通量的贡献受冷空气强度、发生频次和持续时间共同影响.冷空气天数占比虽为16.4 %,但对冷季潜热和感热通量的贡献分别为34.9 %和51.7 %.
| [1] |
Dutra E, Stepanenko VM, Balsamp G et al. An offline study of the impact of lakes on the performance of the ECM-WF surface scheme. Boreal Environment Research, 2010, 15(2): 100-112. |
| [2] |
Long Z, Perrie W, Gyakum J et al. Northern lake impacts on local seasonal climate. Journal of Hydrometeorology, 2007, 8(4): 881-896. DOI:10.1175/JHM591.1 |
| [3] |
Lofgren BM. Simulated effects of idealized laurentian Great Lakes on regional and large-scale climate. Journal of Climate, 1996, 10(11): 2847-2858. DOI:10.1175/1520-0442(1997)010<2847:SEOILG>2.0.CO;2 |
| [4] |
Bonan GB. Sensitivity of a GCM simulation to inclusion of inland water surfaces. Journal of Chemical Ecology, 1995, 8(11): 2691-2704. |
| [5] |
Mackay MD, Neale PJ, Arp CD et al. Modeling lakes and reservoirs in the climate system. Limnology and Oceanography, 2009, 54(6): 2315-2329. DOI:10.4319/lo.2009.54.6_part_2.2315 |
| [6] |
Leavitt PR, Fritz SC, Anderson NJ et al. Paleolimnological evidence of the effects on lakes of energy and mass trans-fer from climate and humans. Limnology and Oceanography, 2009, 54(6PART2): 2330-2348. DOI:10.4319/lo.2009.54.6_part_2.2330 |
| [7] |
Steeburgh WJ, Onton DJ. Multiscale analysis of the 7 December 1998 Great Salt Lake-Effect snowstorm. Monthly Weather Review, 2001, 129(6): 1296-1317. DOI:10.1175/1520-0493(2001)129<1296:MAROTDG>2.0.CO;2 |
| [8] |
Sousounis PJ, Shirer HN. Lake-aggregate mesoscale disturbances. Part Ⅰ: Linear analysis. Journal of the Atmospheric Sciences, 1992, 49(1): 80-100. DOI:10.1175/1520-0469(1992)049<0080:LAMDPI>2.0.CO;2 |
| [9] |
Sousounis PJ, Fritsch JM. Lake-aggregate mesoscale disturbances. Part Ⅱ: A case study of the effects on regional and synoptic-scale weather systems. Bulletin of the American Meteorological Society, 1994, 75(10): 1793-1812. DOI:10.1175/1520-0477(1994)075<1793:LAMDPI>2.0.CO;2 |
| [10] |
Crosman ET, Horel JD. Sea and lake breezes: A review of numerical studies. Boundary-Layer Meteorology, 2010, 137(1): 1-29. DOI:10.1007/s10546-010-9517-9 |
| [11] |
Ljungemyr P, Gustafsson N, Omstedt A. Parameterization of lake thermodynamics in a high-resolution weather forecasting model. Tellus Series A-Dynamic Meteorology & Oceanography, 1996, 48(5): 608-621. DOI:10.1034/j.1600-0870.1996.t01-4-00002.x |
| [12] |
Wu G, Liu Y, Bian H et al. Thermal controls on the asian summer monsoon. Scientific Reports, 2012, 2(5): 404. DOI:10.1038/srep00404 |
| [13] |
Mao R. Forecasting model of evaporation from Lake Taihu and its application. J Lake Sci, 1992, 4(4): 8-13. [毛锐. 太湖水面蒸发量预报模型及其应用. 湖泊科学, 1992, 4(4): 8-13. DOI:10.18307/1992.0402] |
| [14] |
Pal M, Roy MB, Roy PK et al. Fresh water lake model simulation for seasonal variation of latent and sensible heat fluxes from the water surface of Rudrasagar Lake, Tripura. Imperial Journal of Interdisciplinary Research, 2016, 2(5): 1306-1310. |
| [15] |
McGloin R, McGowan H, McJannet D. Effects of diurnal, intra-seasonal and seasonal climate variability on the energy balance of a small subtropical reservoir. International Journal of Climatology, 2015, 35(9): 2308-2325. DOI:10.1002/joc.4147 |
| [16] |
Lorenzzetti JA, Araújo CAS, Curtarelli MP. Mean diel variability of surface energy fluxes over Manso Reservoir. Inland Waters, 2015, 5(2): 155-172. DOI:10.5268/IW-5.2.761 |
| [17] |
Curtarelli M, Alcântara E, Rennó C et al. Effects of cold fronts on MODIS-derived sensible and latent heat fluxes in Itumbiara reservoir (Central Brazil). Advances in Space Research, 2013, 52(9): 1668-1677. DOI:10.1016/j.asr.2013.07.037 |
| [18] |
Marie-Noëlle B, Guy C, Olivier T et al. Long-term heat exchanges over a Mediterranean lagoon. Journal of Geophysical Research Atmospheres, 2012, 117(D23). DOI:10.1029/2012JD017857 |
| [19] |
Granger RJ, Hedstrom N. Modelling hourly rates of evaporation from small lakes. Hydrology and Earth System Sciences, 2011, 15(1): 267-277. DOI:10.5194/hess-15-267-2011 |
| [20] |
Blanken PD, Rouse WR, Culf AD et al. Eddy covariance measurements of evaporation from Great Slave Lake, Northwest Territories, Canada. Water Resources Research, 2000, 36(4): 1069-1077. DOI:10.1029/1999WR900338 |
| [21] |
Liu H, Zhang Y, Liu S et al. Eddy covariance measurements of surface energy budget and evaporation in a cool season over southern open water in Mississippi. Journal of Geophysical Research Atmospheres, 2009, 114(D4): 1-13. DOI:10.1029/2008JD010891 |
| [22] |
Curtarlli MP, Alcântara E, Rennó C et al. Modeling the effects of cold front passages on the heat fluxes and thermal structure of a tropical hydroelectric reservoir. Hydrology and Earth System Sciences Discussions, 2013, 10(7): 8467-8502. DOI:10.5194/hessd-10-84672013 |
| [23] |
Blanken PD, Spence C, Hedstrom N et al. Evaporation from Lake Superior: 1. Physical controls and processes. Journal of Great Lakes Research, 2011, 37(4): 707-716. DOI:10.1016/j.jglr.2011.08.009 |
| [24] |
Blanken PD, Rouse WR, Schertzer WM. Enhancement of evaporation from a large northern lake by the entrainment of warm, dry air. Journal of Hydrometeorology, 2003, 4(4): 680-693. DOI:10.1175/1525-7541(2003)004<0680:EOEFAL>2.0.CO;2 |
| [25] |
Zhang Q, Liu H. Interannual variability in the surface energy budget and evaporation over a large southern inland water in the United States. Journal of Geophysical Research Atmospheres, 2013, 118(10): 4290-4302. DOI:10.1002/jgrd.50435 |
| [26] |
Garratt JR. The atmospheric boundary layer. Earth-Science Reviews, 1994, 37(1/2). DOI:10.1016/0012-8252(94)90026-4 |
| [27] |
Qin B, Xu P, Wu Q et al. Environmental issues of Lake Taihu, China. Hydrobiologia, 2007, 581(1): 3-14. DOI:10.1007/s10750-006-0521-5 |
| [28] |
Zhang PZ, Chen GM. A statistical analysis of the cold wave high which influences on China. Acta Meterologica Sinica, 1999, 57(4): 493-501. [张培忠, 陈光明. 影响中国寒潮冷高压的统计研究. 气象学报, 1999, 57(4): 493-501. DOI:10.11676/qxxb1999.046] |
| [29] |
Lee X, Liu S, Xiao W et al. The Taihu eddy flux network: An observational program on energy, water, and greenh-ouse gas fluxes of a large freshwater lake. Bulletin of the American Meteorological Society, 2014, 95(10): 1583-1594. DOI:10.1175/BAMS-D-13-00136.1 |
| [30] |
Lee X, Finnigan J, Kyaw TPU. Coordinate systems and flux bias error. Netherlands: Springer, 2004: 33-66. DOI:10.1007/1-4020-2265-4.3
|
| [31] |
Webb EK, Pearman GI, Leuning R. Correction of flux measurements for density effects due to heat and water vapour transfe. Quarterly Journal of the Royal Meteorological Society, 1980, 106(447): 85-100. DOI:10.1002/qj.49710644707 |
| [32] |
Wang DD, Wang W, Liu SD et al. Characteristics of modelling hourly water surface evaporation in Lake Taihu and co-mparison of simulation results by three models. J Lake Sci, 2017, 29(6): 1538-1550. [王丹丹, 王伟, 刘寿东等. 太湖小时尺度水面蒸发特征及3种模型模拟效果对比. 湖泊科学, 2017, 29(6): 1538-1550. DOI:10.18307/2017.0626] |
| [33] |
GB/T 20484-2017. Grade of cold air. [GB/T 20484-2017.冷空气等级. ]
|
| [34] |
Zhang Y, Qin B, Zhu G et al. Profound changes in the physical environment of Lake Taihu from 25 years of long-term observations: Implications for algal bloom outbreaks and aquatic macrophyte loss. Water Resources Research, 2018, 54(7): 4319-4331. DOI:10.1029/2017WR022401 |
| [35] |
Chen Q, Han HJ, Zhai SJ et al. Influence of solar radiation and water temperature on chlorophyll-a levels in Lake Taihu, China. Acta Science Circumstantiae, 2009, 29(1): 199-206. [陈桥, 韩红娟, 翟水晶等. 太湖地区太阳辐射与水温的变化特征及其对叶绿素a的影响. 环境科学学报, 2009, 29(1): 199-206.] |
| [36] |
Shang ZT, Ren J, Qin MR et al. Relationships between climate change and cyanobacterial bloom in Lake Taihu. Chinese Journal of Ecology, 2010, 29(1): 55-61. [商兆堂, 任健, 秦铭荣等. 气候变化与太湖蓝藻暴发的关系. 生态学杂志, 2010, 29(1): 55-61.] |
| [37] |
Wang W. Energy budget at Lake Taihu and its response to climate change[Dissertation]. Nanjing: Nanjing University of Information Science & Technology, 2014. [王伟.太湖能量收支及其对气候变化的响应[学位论文].南京: 南京信息工程大学, 2014. ]
|
| [38] |
Wang W, Lee X, Xiao W et al. Global lake evaporation accelerated by changes in surface energy allocation in a war-mer climate. Nature Geoscience, 2018, 11(6): 410-414. DOI:10.1038/s41561-018-0114-8 |
| [39] |
Ma T, Wu Z, Jiang Z. How does coldwave frequency in China respond to a warming climate?. Climate Dynamics, 2012, 39(9/10): 2487-2496. DOI:10.1007/s00382-012-1354-8 |
| [40] |
Jiang Z, Ma T, Wu Z. China coldwave duration in a warming winter: change of the leading model. Theoretical and Applied Climatology, 2012, 110(1/2): 65-75. DOI:10.1007/s00704-012-0613-2 |
| [41] |
Ma T, Jiang Z, Wu Z. Responses of the leading mode of coldwave intensity in China to a warm climate. Acta Meteor-ologica Sinica, 2013, 27(5): 673-683. DOI:10.1007/s13351-013-0103-1 |
| [42] |
Zhao XS, Wang SG, Li M et al. Comparison of actual water evaporation and pan evaporation in summer over the Lake Poyang, China. J Lake Sci, 2014, 26(6): 955-962. [赵晓松, 王仕刚, 李梅等. 鄱阳湖夏季水热通量特征及环境要素影响分析. 湖泊科学, 2014, 26(6): 955-962. DOI:10.18307/2014.0619] |
| [43] |
Verburg P, Antenucci JP, Hecky RE. Differential cooling drives large-scale convective circulation in Lake Tanganyika. Limnology and Oceanography, 2011, 56(3): 910-926. DOI:10.4319/lo.211.56.3.0910 |
| [44] |
Guo X, Liu H, Yang K. On the application of the Priestley-Taylor relation on sub-daily time scales. Boundary Layer Meteorology, 2015, 156(3): 489-499. DOI:10.1007/s10546-015-0031-y |
| [45] |
Gao H, Zhang Y, Ma N. Quantifying surface energy fluxes and evaporation over a significant expanding Endorheic Lake in the central Tibetan Plateau. Journal of the Meteorological Society of Japan, 2016, 94(5): 453-465. DOI:10.2151/jmsj.2016-023 |
| [46] |
Liu H, Blanken PD, Weidinger T et al. Variability in cold front activities modulating cool-season evaporation from a southern inland water in the USA. Environmental Research Letters, 2011, 6(2): 024022. DOI:10.1088/1748-9326/6/2/024022 |
| [47] |
Lofgren BM, Zhu Y. Surface energy fluxes on the Great Lakes based on satellite-observed surface temperatures 1992 to 1995. Journal of Great Lakes Research, 2013, 26(3): 305-314. |
| [48] |
Nordbo A, Launiainen S, Mammarella I et al. Long-term energy flux measurements and energy balance over a small boreal lake using eddy covariance technique. Journal of Geophysical Research Atmospheres, 2011, 116(D2): 1-17. DOI:10.1029/2010JD014542 |
| [49] |
Shao C, Chen J, Stepien CA et al. Diurnal to annual changes in latent, sensible heat, and CO2 fluxes over a Laurentian Great Lake: A case study in Western Lake Erie. Journal of Geophysical Research: Biogeosciences, 2015, 120(8): 1587-1604. DOI:10.1002/2015JG003025 |
| [50] |
Curtarlli MP, Alcântara E, Rennó C et al. Physical changes within a large tropical hydroelectric reservoir induced by wintertime cold front activity. Hydrology and Earth System Sciences, 2014, 18(8): 3079-3093. DOI:10.5194/hess-18-3079-2014 |
| [51] |
Lenters JD, Kratz TK, Bowser CJ. Effects of climate variability on lake evaporation: Results from a long-term energy budget study of Sparkling Lake, northern Wisconsin (USA). Journal of Hydrology, 2005, 308(1/2/3/4): 168-195. DOI:10.1016/j.jhydrol.2004.10.028 |
| [52] |
Oswald CJ, Rouse WR. Thermal characteristics and energy balance of various-size Canadian shield lakes in the Mackenzie River Basin. Journal of Hydrometeorology, 2004, 5(1): 129-144. DOI:10.1016/j.jhydrol.2004.10.028 |
| [53] |
Li Z, Lyu S, Ao Y et al. Long-term energy flux and radiation balance observations over Lake Ngoring, Tibetan Plateau. Atmospheric Research, 2015, 155(155): 13-25. DOI:10.1016/j.atmosres.2014.11.019 |
| [54] |
Curtarlli MP, Rennó C, Alcântara E et al. Effects of cold front passage and atmospheric boundary layer stability in the estimates of spatially distributed heat fluxes in a tropical reservoir. Geoscience and Remote Sensing Symposium, 2012, 5246-5249. DOI:10.1109/IGARSS:2012.6352426 |
 2019, Vol. 31

