(2: 河北省污染防治生物技术实验室, 石家庄 050018)
(2: Biotechnology Laboratory for Pollution Control in Hebei Province, Shijiazhuang 050018, P. R. China)
我国是一个多湖泊的国家[1],目前共有1.0 km2以上的自然湖泊2693个,约占全国国土面积的0.9 % [2].湖泊在维护区域生态与环境安全方面具有特殊地位[3],其作为具有明确边界的独立生态系统,极易受到环境变化的影响[4].然而,近年来随着社会经济发展以及人为活动增强,湖泊富营养化趋势加剧[5-6].据2017年水利部水资源公报,在全国117个监测湖泊中,富营养化湖泊占76.9 % [7].值得关注的是,富营养化会改变湖泊食物网结构,进而影响湖泊生态系统的功能(能流和物流)[8-12].
国际湖沼学的长期研究发现,一个完整的湖泊食物网应包括底栖食物网和浮游食物网[13].在底栖和浮游食物网关系研究中,Vadeboncoeur等建立了相互独立、种间资源竞争、物质传递和相互耦合4种关系的概念模型[14],实证研究结果表明鱼类是湖泊中底栖和浮游食物网的整合者.在鱼类的食物来源中,浮游动物占20 %,底栖动物占48 % [15];此外,浮游藻类和底栖动物间的捕食关系等都证明了底栖-浮游食物网为相互耦合关系.如:在美国密歇根湖,沉降的浮游藻类是底栖端足类(Amphipoda)的主要碳源[16],而这些端足类的生物量占底栖无脊椎动物总生物量的65 %,同时端足类也是浮游鱼类的主要食物来源[17].而营养条件变化会显著改变底栖-浮游食物网的结构和功能[18],进而影响湖泊生态系统的能流和物流,特别是在底栖-浮游食物网耦合关系较紧密的浅水湖泊中,这种影响尤为显著.如:在贫营养条件下,浅水湖泊是以底栖初级生产力为主,底栖藻类占比高达80 % ~98 %;而在富营养化条件下,则向以浮游初级生产力为主转变,浮游藻类占比接近100 % [19],浮游藻类生物量的增加会显著增强底栖动物与浮游藻类的耦合关系[20].可见,湖泊富营养化会显著改变底栖生物群落与浮游生物群落之间的能流和物流关系.
湖泊富营养化对湖泊生态系统能流和物流的影响存在不确定性[21],目前研究多关注富营养化对浅水湖泊食物网结构的影响[18],而有关富营养化对湖泊消费者群落碳源和氮源的影响及其时空分异特征则较少关注.近年来,碳、氮稳定同位素技术被用于定量分析生态系统中的能量流动和物质循环[22-23].通过比较消费者和潜在食物来源之间的碳、氮稳定同位素比值,可定量估算消费者不同食物来源的相对贡献[24].白洋淀作为华北地区最大的浅水草型湖泊,在维持区域生物多样性和生态安全中发挥着重要的作用[25].近年来由于自然因素和人为干扰的影响,白洋淀总体营养状态呈现轻度-中度富营养[26].目前有关白洋淀富营养化对消费者种群碳源和氮源的影响尚未研究.鉴于此,本研究于2018年4月(平水期)和8月(丰水期)在白洋淀32个采样点进行样品采集,分别收集水体、沉积物、浮游和底栖生物样品,基于碳、氮稳定同位素分析技术,分析白洋淀消费群落碳源和氮源贡献百分比的时空分布特征,揭示富营养化对白洋淀生态系统能流和物流的影响,为白洋淀生态系统修复提供数据和理论支撑,也为构建蓝绿交织的雄安新区提供生态保障.
1 材料与方法 1.1 研究区概况白洋淀是华北地区最大的内陆浅水湖泊,由藻苲淀、马棚淀、腰葫芦淀等143个大小不等的淀泊组成,总面积366 km2,平均水深2~4 m[27-30].白洋淀有8条主要入淀河流,其中仅府河和孝义河常年有水,来水均为城镇污水处理厂处理后尾水[31].本研究在白洋淀8个区共选取了32个采样点(图 1),分别采集浮游生物、底栖生物和鱼类等生物样品,以及水体和沉积物样品.

|
图 1 白洋淀采样点分布(Ⅰ-藻苲淀区,Ⅱ-南刘庄区,Ⅲ-烧车淀区,Ⅳ-枣林庄区,Ⅴ-光淀区,Ⅵ-圈头区,Ⅶ-采蒲台区,Ⅷ-端村区) Fig.1 Distribution of sampling sites in Lake Baiyangdian |
在2018年4月和8月,分别采集了白洋淀32个样点的表层水体、沉积物、浮游植物、浮游动物、沉水植物、底栖藻类、底栖大型无脊椎类动物和鱼类.沉水植物样品用镰式采草器在水样采样点的周围采集;在采样点用采水器采集浮游动物和浮游植物样品,分别经112 μm和64 μm孔径浮游生物网过滤,得到的浮游动物(个体>112 μm)和浮游植物样品(大小为64~112 μm)[12];底栖藻类采用人工放置基质的方法采集[12].将采集的沉水植物、底栖藻类、浮游动物和浮游植物低温保存后带回实验室[32],用10 %盐酸酸化处理,然后用蒸馏水清洗干净,在-70℃下冷冻干燥72 h至恒重,用研钵研磨成均匀粉末后放入细菌保存管中保存[12];鱼类样品均来自当地渔民直接捕捞或垂钓,将采集的鱼样现场密封充氧气后运回实验室进行前处理,常温下将鱼样分类平摊拍照并鉴定其种类,测量并记录鱼体体长和体重(表 1和表 2).每尾鱼样测量全长、体重后,取背部白肌.对于个体较小的鱼类,则测定其全鱼的同位素值[33].底栖大型无脊椎类动物利用改良的1/16 m2彼得森采泥器进行定量采样,根据相关方法对其进行鉴定、分类和计数[34-35].将鱼类和底栖大型无脊椎类动物在真空干燥仪中冷冻干燥至恒重(-70℃,72 h左右),使用研钵研至均匀粉末,放入干燥器中保存待测[36].
采用容量为4 L的低密度聚乙烯容器收集经过适当过滤的水样,在低温下保存并送回实验室进行分析[37].水深(WD)、温度(T)和溶解氧(DO)等水质指标直接在现场采用便携式水质分析仪(HYDRO LAB,DS5X)进行测定[30, 38].水样分析方法参照相关国家标准方法《水和废水分析检测方法(第4版)》[39],进行亚硝态氮(NO2--N)、硝态氮(NO3--N)、氨氮(NH3-N)、化学需氧量(COD)、总氮(TN)、总磷(TP)和磷酸盐(PO43--P)等水质理化指标的测定.
将沉积物样品用聚乙烯塑封袋封口标记,冷藏并送至实验室分析.干燥后的样品转移至玻璃盘中,筛选去除异物,用聚乙烯袋保存备用[38].沉积物总氮(TNs)、总磷(TPs)、总碳(TCs)和总有机碳(total organic carbon,TOCs)按照标准方法(GB 7173-1987、GB 9387-1988和GB 9834-1988)测定[32].沉积物氨氮(NH3-Ns)、硝态氮(NO3--Ns)根据HJ 634-2012标准方法测定.
1.3 稳定同位素比值分析所有生物样品均运用元素分析仪(Elementar Pyro Cube,德国)与美国Thermo公司的EA-DELTA plus XP稳定同位素比率质谱仪进行分析.碳、氮稳定同位素标准值分别以拟箭石(VPDB)中的碳和纯化的大气中N2作为参考标准,碳、氮稳定同位素值(δ值)的计算公式分别为[40]:
| $ {\delta ^{13}}{\rm{C}}(\% ) = \left[ {\frac{{{{\left( {^{13}{\rm{C}}{/^{12}}{\rm{C}}} \right)}_{{\rm{Sample }}}}}}{{{{\left( {^{13}{\rm{C}}{/^{12}}{\rm{C}}} \right)}_{{\rm{Standard }}}}}} - 1} \right] \times {10^3} $ | (1) |
| $ {\delta ^{15}}{\rm{N}}(\% ) = \left[ {\frac{{{{\left( {^{15}{\rm{N}}{/^{14}}{\rm{N}}} \right)}_{{\rm{Sample }}}}}}{{{{\left( {^{15}{\rm{N}}{/^{14}}{\rm{N}}} \right)}_{{\rm{Standard }}}}}} - 1} \right] \times {10^3} $ | (2) |
为确保实验结果的精度和准确度,每测定10个样品插入1个标准样品,并随机挑选1~2个样品进行复测,分析精度为δ13C < 0.2 ‰,δ15N < 0.3 ‰.样品测试分析均在中国科学院植物研究所完成.
1.4 数据处理与分析 1.4.1 营养级的计算消费者和食物间的δ15N差异就是营养分馏值,随着营养级的增加δ15N不断增加,不同营养级间的δ15N富集的平均值为3.4 ‰.营养级(TL)的计算公式为[41-42]:
| $ TL = \frac{{{\delta ^{15}}{{\rm{N}}_{{\rm{Consumer }}}} - {\delta ^{15}}{{\rm{N}}_{{\rm{Baxe }}}}}}{{\Delta {\delta ^{15}}{\rm{N}}}} + \lambda $ | (3) |
式中,Δδ15N=3.4 ‰,δ15NConsumer是消费者δ15N测定值,δ15NBase是生态系统食物网的初级生产者或初级消费者的氮稳定同位素值(λ=1时,δ15NBase为初级生产者的δ15N值,λ=2时,δ15NBase为初级消费者的δ15N值),本研究根据Post[42]的建议选取螺类作为基线生物来计算各生物群落的营养级.
1.4.2 浮游和底栖生物对消费者群落氮贡献百分比的计算运用同位素混合模型估算浮游生物对消费者群落食物来源的贡献,并比较消费者群落对底栖氮源和浮游氮源依赖程度的差异[42],计算公式为:
| $ 浮游生物的百分比\left( \% \right) = 1 - \frac{{{{\rm{\delta }} ^{15}}{{\rm{N}}_{浮游生物}} - {{\rm{\delta }} ^{15}}{{\rm{N}}_{消费者}} + {{\rm{\delta }} ^{15}}{\rm{N}}}}{{{{\rm{\delta }} ^{15}}{{\rm{N}}_{浮游生物}} - {{\rm{\delta }} ^{15}}{{\rm{N}}_{底栖生物}}}} \times 100\% $ | (4) |
式中,Δδ15N表示每递增一个营养级的富集常数,通常假定为3.4 ‰;底栖生物的百分比(%)=1-浮游生物的百分比(%).
1.4.3 浮游和底栖生物对消费者群落碳贡献百分比的计算运用稳定同位素混合方程可估算消费者群落碳源的百分比.本研究运用二元同位素混合模型计算底栖/浮游生物对消费者群落碳源贡献百分比(f)[43-44],计算公式为:
| $ {f_{底栖生物}}\left( \% \right) = \frac{{\left( {{{\rm{\delta }}^{13}}{{\rm{C}}_{消费者}} - {{\rm{\delta }}^{13}}{{\rm{C}}_{浮游生物初级生产者}}} \right)}}{{{{\rm{\delta }}^{13}}{{\rm{C}}_{底栖生物初级生产者}} - {{\rm{\delta }}^{13}}{{\rm{C}}_{浮游生物初级生产者}}}} \times 100\% $ | (5) |
式中,δ13C浮游生物初级生产者和δ13C底栖生物初级生产者是主要初级生产者的碳值;f浮游生物(%)=1-f底栖生物(%).
1.4.4 统计分析进行统计分析前对数据进行正态分布检验与数据标准化转换的预处理,采用双变量Pearson等级相关系数识别消费者群落δ13C和δ15N值的驱动因子,采用单因素(One-way ANOVA)方差分析(P=0.05)对不同时间不同种类的水生生物和营养级进行差异性检验.所有的数据处理及统计分析均在SPSS 24.0统计软件中进行[45],利用Origin 8.6软件进行绘图.
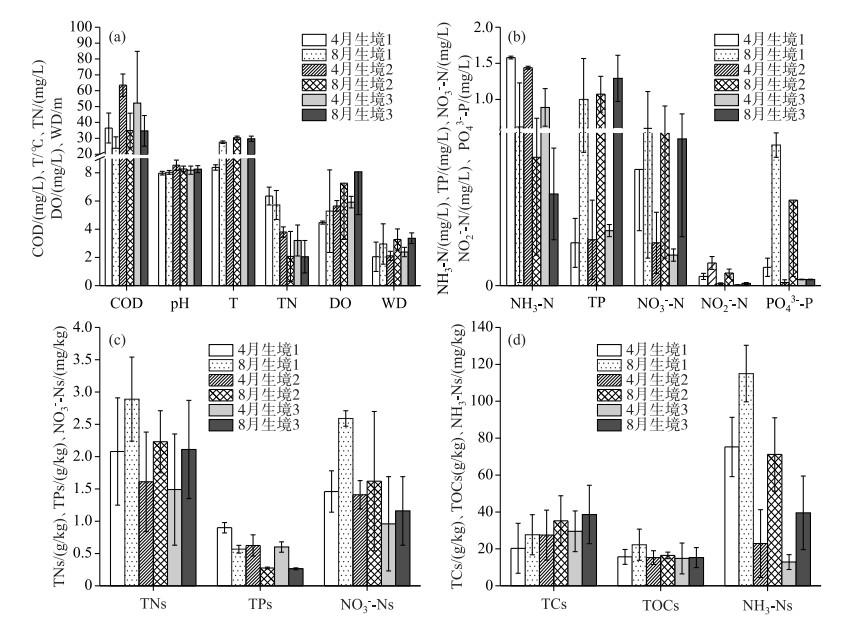
2 结果与讨论 2.1 白洋淀3类生境理化参数时空分异特征根据8个区域水体和沉积物理化参数,运用聚类分析将32个采样点分为3类生境(图 2):第1类生境主要受城市污水影响(Ⅰ和Ⅱ区);第2类生境主要受养殖业和农村生活污水影响(Ⅴ、Ⅶ和Ⅷ区);第3类生境较少受人为干扰(Ⅲ、Ⅳ和Ⅵ区).就水体和沉积物理化参数季节变化而言,除pH相对稳定外,COD、NH3-N、TN和TPs 4月高于8月,而其他理化参数的值则8月高于4月;就空间分布而言,T、WD,DO和TCs值在生境3中最高,而其他理化参数的值则在生境1中最高(图 3).由于2018年4月白洋淀实行生态补水,使8月白洋淀水位升高,有效降低了富营养化程度.

|
图 2 白洋淀不同区域水体和沉积物理化参数聚类图 Fig.2 The cluster map of physical and chemical parameters of water and sediment in different areas of Lake Baiyangdian |
|
图 3 白洋淀不同时空水体和沉积物主要理化参数 Fig.3 Main physical and chemical parameters of water and sediment in different time and space in Lake Baiyangdian |
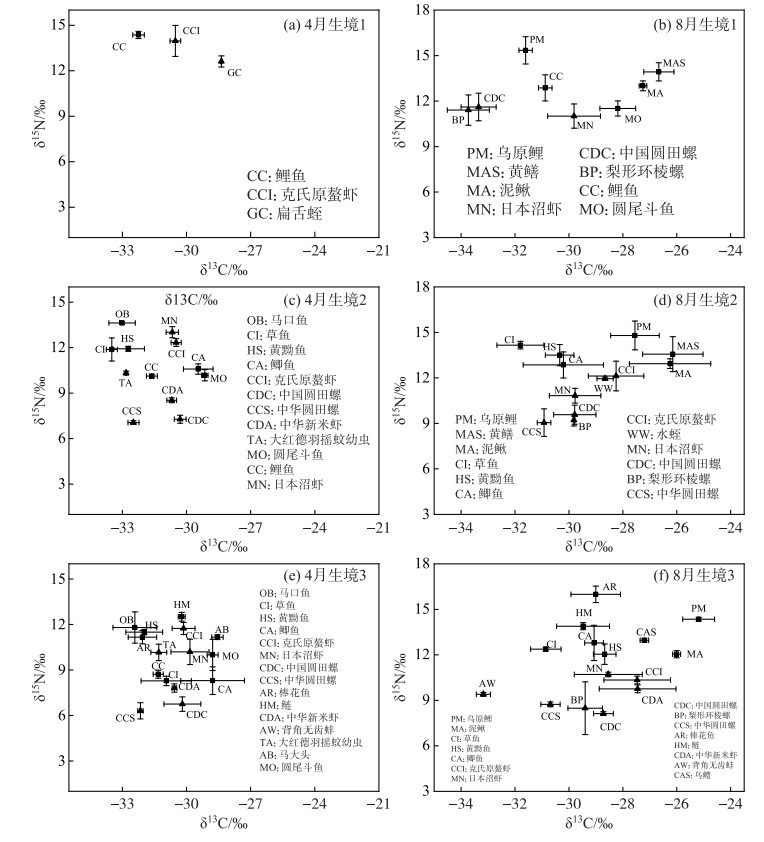
δ13C通常用来判断生态系统中消费者的食物来源[46-47],不同食物来源的δ13C值存在差异.本研究4月共采集16种消费者(表 1、表 2),生境1采集了3种,其δ13C值为-32.25 ‰ ~-28.37 ‰ (均值-30.38 ‰ ±1.59 ‰);生境2采集了12种,其δ13C值为-33.49 ‰ ~-29.14 ‰ (均值-31.47 ‰ ±1.38 ‰);生境3采集了15种,其δ13C值为-32.41 ‰ ~-28.56 ‰ (均值-30.62 ‰ ±1.23 ‰)(图 4).对于同一消费者而言,如克氏原螯虾在生境3中的δ13C值最高(-30.14 ‰)其次为生境2(-30.48 ‰)和生境1(-30.52 ‰). 8月共采集19种消费者(表 1、表 2),其中生境1采集了8种,其δ13C值为-33.73 ‰ ~-26.66 ‰ (均值-30.43 ‰ ±2.46 ‰),生境2采集了12种,其δ13C值为-31.80 ‰ ~-26.15 ‰ (均值-29.20 ‰ ± 1.66 ‰);生境3采集了15种,其δ13C值为-33.17 ‰ ~-25.19 ‰ (均值-28.73 ‰ ±1.91 ‰)(图 4).对于同一消费者而言,如日本沼虾在生境1、生境2和生境3中的δ13C值分别为-29.81 ‰、-29.77 ‰和-28.54 ‰.
| 表 1 白洋淀鱼类群落样品采集名录 Tab. 1 Sample collection of fish communities in Lake Baiyangdian |
| 表 2 白洋淀底栖动物群落样品采集名录 Tab. 2 Sample collection of benthic communities in Lake Baiyangdian |
就消费者群落δ15N值而言:在4月,生境1的δ15N值为12.61 ‰ ~14.36 ‰ (均值13.64 ‰ ±0.75 ‰),生境2的值为7.06 ‰ ~13.62 ‰ (均值10.68 ‰ ±1.99 ‰),生境3的值为6.31 ‰ ~12.51 ‰ (均值9.76 ‰ ±1.88 ‰).对于同一消费者而言,如鲤鱼δ15N值在生境1中最高(14.36 ‰),而在生境3中最低(8.71 ‰)(图 4).通过方差分析,结果表明3类生境消费者群落的δ15N值存在显著差异(F=3.362,P < 0.05).随着富营养化程度增加,从生境3到生境1的δ15N值逐渐偏正.在8月,生境1的δ15N值为11.01 ‰ ~15.34 ‰ (均值12.46 ‰ ±1.36 ‰),生境2的值为9.05 ‰ ~14.80 ‰ (均值12.22 ‰ ±1.80 ‰),生境3的值为8.13 ‰ ~15.99 ‰ (均值11.47 ‰ ±2.26 ‰).对于同一消费者而言,如梨形环棱螺的δ15N值在生境1最高(11.40 ‰),而在生境3最低(8.48 ‰)(图 4).人为活动引起的营养物质输入导致初级生产者δ15N值升高[48-49],通过捕食-被捕食关系,进而传递到整个食物网.因而在白洋淀对同种消费者而言,δ15N值呈现显著的空间差异,其值在生境1中最高,而在生境3中最低.
|
图 4 4月、8月不同生境底栖动物群落(三角形)和鱼类群落(正方形)的δ13C和δ15N值 Fig.4 The δ13C and δ15N for consumer benthic communities (triangles) and fish communities (squares) in different habitats in April and August |
δ13C能够表征生物中碳元素的来源[50-51]. 4月白洋淀消费者群落的δ13C值为-33.49 ‰ ~-28.37 ‰,而8月为-33.73 ‰ ~-25.18 ‰,结果表明消费者群落8月的食物来源比4月更广[33].白洋淀消费者群落的δ13C值低于草海湿地食物链底栖动物(-27.40 ‰ ~-24.53 ‰)和鱼类(-26.10 ‰ ~-14.69 ‰)[52],这可能与地理环境和生态系统碳源的差异有关.在4月,白洋淀消费者群落δ15N值(11.36 ‰ ±1.54 ‰)比胶州食物网(11.98 ‰ ±1.77 ‰)[48]和三峡水库鱼类的δ15N值(11.98 ‰ ±2.25 ‰)低[40];而在8月,白洋淀消费者群落的δ15N值(12.05 ‰ ± 1.81 ‰)略高于胶州食物网(11.98 ‰ ±1.77 ‰)和三峡水库鱼类的δ15N值(11.98 ‰ ±2.25 ‰).在8月(丰水期),进入雨季,由河流向湖泊生态系统迁移的氮迅速增加[52-55],使沉水植物等初级生产者的δ15N值增大,通过食物网的传递,进而使白洋淀消费者的δ15N值增大.运用单因素方差分析,不同季节消费者群落的δ13C值存在显著差异(F=5.752,P < 0.05),而δ15N值未呈现显著差异(P > 0.05),这与东洞庭湖鱼类的δ15N值[33]研究结果一致.且消费者群落的δ13C和δ15N呈显著负相关(P < 0.01);这与草海湿地食物链的[50](r=-0.423,P < 0.01)研究结果一致,而与东太湖的研究结果却相反[56].相反的结果说明了不同湖泊同位素对环境变化的响应不同.由于白洋淀受人为活动干扰较大,使得白洋淀中基底物质的氮同位素值变化较大[52].
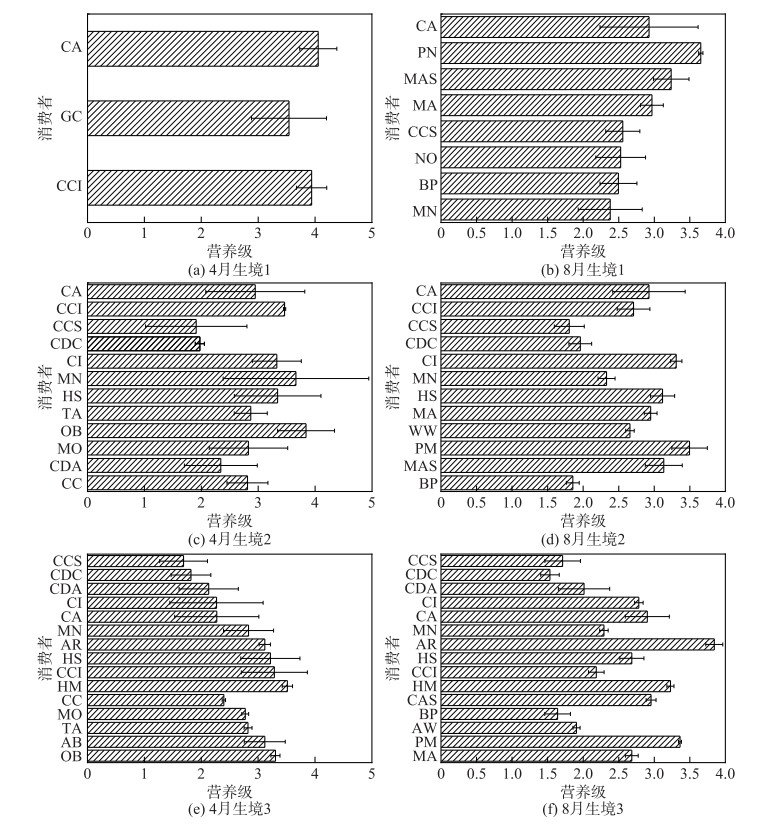
2.3 白洋淀消费者群落营养级时空分异特征 2.3.1 白洋淀消费者群落营养级空间分异特征在4月,消费者群落在生境1中的营养级为3.54~4.06,生境2中的营养级为1.91~3.84,生境3中的营养级为1.69~3.51.对于同一消费者而言,如克氏原螯虾,其营养级在生境1(TL=3.94)中最高,其次为生境2(TL=3.46)和生境3(TL=3.28)(图 5).运用方差分析,结果表明3类生境消费者群落的营养级存在显著差异(F=3.348,P < 0.05).在8月,消费者群落在生境1中的营养级为2.38~3.66,生境2中的营养级为1.81~3.50,生境3中的营养级为1.53~3.85(图 5).同一消费者营养级在生境1最高,而在生境3中最低(图 5).这主要是因为生境1中处于强人为干扰,富营养化程度较高,城市污水的排放使消费者的δ15N值增高,因此消费者群落营养级会受生境条件的影响[57].人为干扰会影响水生生态系统中生物的营养级[40],例如鱼类营养级在强人为干扰的水库中要显著高于低人为干扰的水库[40],且消费者群落的δ15N值与农业生产、生活排放的污水呈较高的相关性[58].
|
图 5 4、8月不同生境营养级 Fig.5 Trophic level in different habitats in April and August |
在生境1中,4月和8月未见同种消费者;生境2中同种消费者的营养级4月高于8月,但差异不显著;生境3中同种消费者营养级4月低于8月,但差异也不显著.因此,白洋淀消费者群落营养级没有明显的季节变化,这与东洞庭湖鱼类的研究结果相同[33].
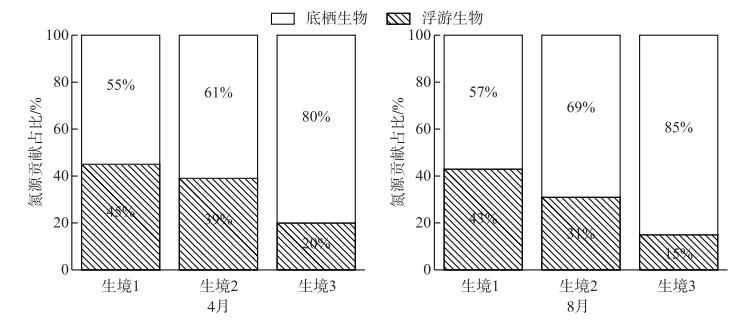
2.4 白洋淀浮游和底栖生物对消费者群落碳源和氮源贡献百分比的时空分异特征4月和8月,白洋淀浮游生物对消费者群落氮源贡献百分比在生境1、生境2、和生境3中分别为45 %和43 %、39 %和31 %、20 %和15 %;底栖生物对消费者群落氮源贡献百分比分别为55 %和57 %、61 %和69 %、80 %和85 % (图 6).浮游生物对消费者群落氮源贡献百分比4月高于8月,且最大值出现在生境1.这可能是由于生境1受人为活动影响较大,导致水体和生物的δ15N值升高[59],且浮游动物氮稳定同位素值与水体中氮浓度有关[60].底栖生物对消费者种群的氮源贡献百分比在8月高于4月,这可能是因为沉水植物在夏季生长旺盛,对消费者的食物贡献也随之加大.
|
图 6 底栖和浮游生物对消费者群落氮源贡献占比 Fig.6 Pelagic and benthic communities contribute percentages of nitrogen sources to consumer populations |
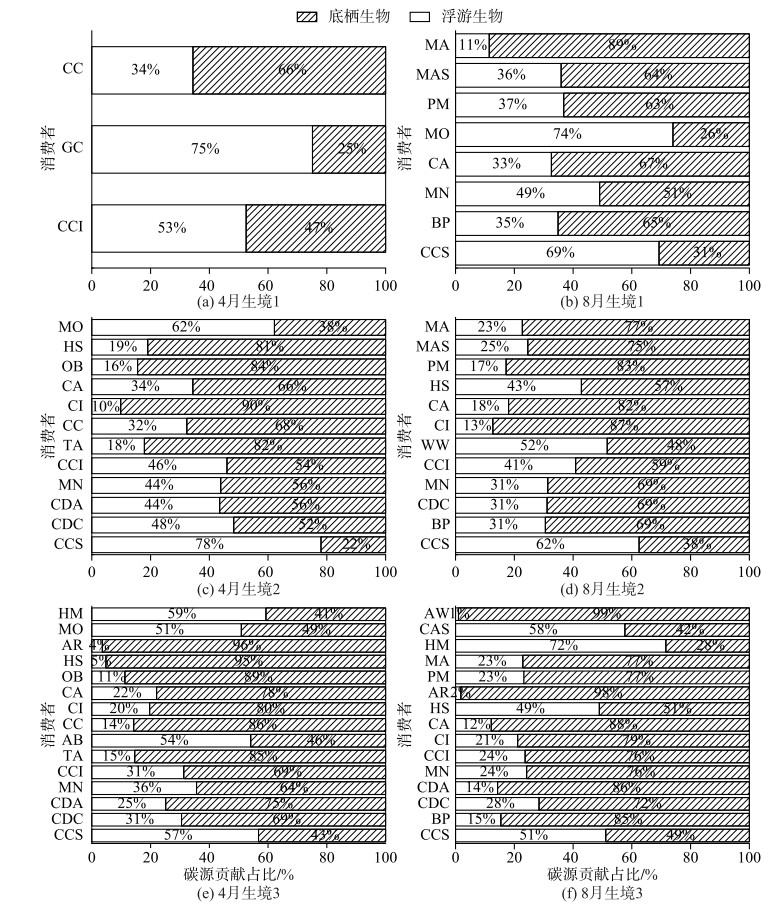
就浮游和底栖生物对消费者群落碳源贡献百分比而言(图 7),底栖生物对消费者的碳源贡献百分比在8月高于4月,且生境3高于其他生境;浮游生物对消费者的碳源贡献百分比在4月高于8月,且生境1高于其他生境.
|
图 7 底栖和浮游生物对消费者群落的碳源贡献占比 Fig.7 Pelagic and benthic communities contribute percentages of carbon sources to consumer populations |
不同种类消费者群落的δ13C和δ15N组成呈现显著差异,δ13C和δ15N值主要受食物来源、各来源比例以及生境等因素影响[61].湖泊生境变化会改变浮游植物等生产者的δ15N值,进而影响消费者的δ15N值[62],有研究表明在磷输入负荷增加后,初级生产者对氮的吸收也同时增加,降低了氮同位素分馏,使得15N值上升,进而造成消费者种群的δ15N值也随之增加[63-64].因此,湖泊富营养化会改变生产者的δ13C和δ15N,进而影响消费者群落的δ13C和δ15N值.
本研究运用相关性分析来明晰富营养化对白洋淀消费者群落碳、氮稳定同位素特征的影响,结果表明白洋淀消费者群落的δ13C值与TP、TCs、TNs、TOCs、TPs等环境因子呈现负相关关系;而δ15N值与TP、TCs、TNs、TOCs、TPs呈现正相关关系(表 3).近年来白洋淀接受了流域大量的工业废水、生活污水和农业污水,导致白洋淀水体和沉积物中TP、TN等含量升高,湖泊富营养化较为严重,长期生活在这种重污染水体中的生物体内δ15N值偏正[65].这与其他研究的结论一致[12],即δ15N值会随着湖泊富营养化水平的增加而逐渐偏正.湖泊富营养化伴随着大量的有机质分解、溶解氧浓度降低,导致湖泊沉积物中微生物反硝化作用的增强,产生了较大的δ15N分馏[66].在反硝化过程中较轻的氮同位素随着氮气而释放,较重的氮同位素保留在剩余水体氮库中,导致水体15N偏正,进而使生活在其中的生物其δ15N值偏正[66].湖泊富营养化会影响浮游生物等食物源的δ13C值,进而影响消费者的δ13C值.相关研究表明外源碳(δ13C值偏正)对浮游动物碳源的贡献量在贫营养湖泊中较高[67],致使浮游植物和浮游动物的δ13C值存在一定程度上的差异,即浮游动物碳源因受外源碳影响进而使其δ13C值偏正;而在富营养湖泊中,浮游动物有机碳源主要受内源碳(如浮游植物)的影响[68],导致有机碳传输过程中浮游植物与浮游动物之间有较强的耦合作用并且δ13C显著相似.浮游生物δ13C值的变化,最终会影响以其为食物源的消费者的δ13C值.这些结论进一步证实富营养化会影响水生生物的δ13C和δ15N值,进而影响底栖和浮游生物对消费者群落碳源和氮源贡献的百分比.
| 表 3 白洋淀消费者群落的碳、氮稳定同位素值与环境因子相关性分析 Tab. 3 Correlation analysis of carbon and nitrogen stable isotope values of consumer populations and environmental factors in Lake Baiyangdian |
1) 白洋淀消费者群落的δ13C值呈现显著的时空差异,消费者群落的δ13C值受季节变化和生境条件的影响;而δ15N值和营养级呈现显著的空间差异,季节变化不显著,其主要与生境条件有关.
2) 白洋淀浮游生物和底栖生物对消费者群落碳源和氮源贡献百分比受到季节变化和生境条件的影响.富营养化越强,则浮游生物对消费者群落碳源和氮源贡献百分比的值越高,底栖生物对消费者群落碳源和氮源贡献百分比的值越低,反之亦然.
3) 湖泊富营养化会影响消费者群落浮游生物/底栖生物对消费者群落碳源和氮源贡献的百分比,进而影响湖泊生态系统的能流和物质流.
| [1] |
Wang SR, Duan B. China's lake eutrophication and protection and management needs. Democracy and Science, 2018(5): 21-24. [王圣瑞, 段彪. 我国湖泊富营养化及保护治理需求. 民主与科学, 2018(5): 21-24.] |
| [2] |
Zhang LL, Liu JL, Zhang SW et al. AQUATOX model for ecological threshold and ecosystem risk assessment of polybrominated diphenyl ethers (PBDEs) in Baiyangdian lake ecosystems. Asian Journal of Ecotoxicology, 2014, 9(6): 1156-1172. [张璐璐, 刘静玲, 张少伟等. 基于AQUATOX模型的白洋淀湖区多溴联苯醚(PBDEs)的生态效应阈值与生态风险评价研究. 生态毒理学报, 2014, 9(6): 1156-1172.] |
| [3] |
Ma RH, Yang GS, Duan HT et al. The number, area and spatial distribution of lakes in China. Science in China:Earth Sciences, 2011, 41(3): 394-401. [马荣华, 杨桂山, 段洪涛等. 中国湖泊的数量、面积与空间分布. 中国科学:地球科学, 2011, 41(3): 394-401.] |
| [4] |
Yang YF, Zhou XD, Yi YJ et al. Influence of debris flows on macroinvertebrate diversity and assemblage structure. Ecological Indicators, 2018, 85: 781-790. DOI:10.1016/j.ecolind.2017.11.008 |
| [5] |
Xu QG, Xi BD, Cao JL eds. Eutrophication of lakes in China and its regional differences. Beijing: Science Press, 2016. [许其功, 席北斗, 曹金玲. 中国湖泊富营养化及其区域差异. 北京: 科学出版社, 2016.]
|
| [6] |
Song XW, Zhao L, Xie YM et al. Lake ecosystem service function value estimation and protection countermeasures. Environmental Science and Management, 2019, 44(1): 162-166. [宋晓薇, 赵侣璇, 谢祎敏等. 湖泊生态系统服务功能价值估算及保护对策研究. 环境科学与管理, 2019, 44(1): 162-166.] |
| [7] |
China Water Resources Bulletin. 2017 Ministry of Water Resources of the People's Republic of China. Beijing, 2018. [中华人民共和国水利部. 2017年度中国水资源公报.北京, 2018. ]
|
| [8] |
Xu J, Zhang M. Primary consumers as bioindicator of nitrogen pollution in lake planktonic and benthic food webs. Ecological Indicators, 2012, 14(1): 189-196. DOI:10.1016/j.ecolind.2011.02.012 |
| [9] |
Vander Zanden MJ, Vadeboncoeur Y, Diebel MW et al. Primary consumer stable nitrogen isotopes as indicators of nutrient source. Environmental Science & Technology, 2005, 39(19): 7509-7515. DOI:10.1021/es050606t |
| [10] |
Baeta A, Niquil N, Marques JC et al. Modelling the effects of eutrophication, mitigation measures and an extreme flood event on estuarine benthic food webs. Ecological Modelling, 2011, 222(6): 1209-1221. DOI:10.1016/j.ecolmodel.2010.12.010 |
| [11] |
Taipale SJ, Vuorio K, Aalto SL et al. Eutrophication reduces the nutritional value of phytoplankton in boreal lakes. Environmental Research, 2019, 179. |
| [12] |
Liang H, Huang LP, Chen GJ et al. Patterns of carbon and nitrogen stable isotopes and elemental composition of lake primary producers and zooplankton in Eastern Yunnan. J Lake Sci, 2018, 30(5): 1400-1412. [梁红, 黄林培, 陈光杰等. 滇东湖泊水生植物和浮游生物碳、氮稳定同位素与元素组成特征. 湖泊科学, 2018, 30(5): 1400-1412. DOI:10.18307/2018.0521] |
| [13] |
Vadeboncoeur Y, Peterson G, Vander Zanden MJ et al. Benthic algal production across lake size gradients:Interactions among morphometry, nutrients, and light. Ecology, 2008, 89(9): 2542-2552. DOI:10.1890/07-1058.1 |
| [14] |
Vadeboncoeur Y, Vander Zanden MJ, Lodge DM. Putting the lake back together:Reintegrating benthic pathways into lake food web models. BioScience, 2002, 52(1): 44-54. DOI:10.1641/0006-3568(2002)052[0044:PTLBTR]2.0.CO;2 |
| [15] |
Zanden MJV, Vadeboncoeur Y. Fishes as integrators of benthic and pelagic food webs in lakes. Ecology, 2002, 83(8): 2152-2161. DOI:10.1890/0012-9658(2002)083[2152:FAIOBA]2.0.CO;2 |
| [16] |
Fitzgerald SA, Gardner WS. An algal carbon budget for pelagic-benthic coupling in Lake Michigan. Limnology and Oceanography, 1993, 38(3): 547-560. DOI:10.4319/lo.1993.38.3.0547 |
| [17] |
Xue B, Jiang RJ, Wang K et al. Feeding habits of Sebastiscus marmoratus in the Gouqi Island based on stable istope analysis. Journal of Fisheries of China, 2017, 41(9): 1415-1423. [薛彬, 蒋日进, 王凯等. 应用稳定同位素技术分析枸杞岛近岸海域褐菖鲉的食性. 水产学报, 2017, 41(9): 1415-1423.] |
| [18] |
Li H, Shen HY, Li SJ et al. Effects of eutrophication on the benthic-pelagic coupling food web in Baiyangdian Lake. Acta Ecologica Sinica, 2018, 38(6): 2017-2030. [李华, 沈洪艳, 李双江等. 富营养化对白洋淀底栖-浮游耦合食物网结构和功能的影响. 生态学报, 2018, 38(6): 2017-2030.] |
| [19] |
Krause-Jensen D, Markager S, Dalsgaard T. Benthic and pelagic primary production in different nutrient regimes. Estuaries and Coasts, 2012, 35(2): 527-545. DOI:10.1007/s12237-011-9443-1 |
| [20] |
Chandra S, Jake Vander Zanden M, Heyvaert AC et al. The effects of cultural eutrophication on the coupling between pelagic primary producers and benthic consumers. Limnology and Oceanography, 2005, 50(5): 1368-1376. DOI:10.4319/lo.2005.50.5.1368 |
| [21] |
Zhang Y, Ding S, Bentsen CN et al. Differences in stream fish assemblages subjected to different levels of anthropogenic pressure in the Taizi River catchment, China. Ichthyological Research, 2015, 62(4): 450-462. DOI:10.1007/s10228-015-0459-6 |
| [22] |
Thornton SF, McManus J. Application of organic carbon and nitrogen stable isotope and C/N ratios as source indicators of organic matter provenance in estuarine systems:Evidence from the Tay estuary, Scotland. Estuarine, Coastal and Shelf Science, 1994, 38(3): 219-233. DOI:10.1006/ecss.1994.1015 |
| [23] |
Hobson KA, Fisk A, Karnovsky N et al. A stable isotope (δ13C, δ15N) model for the North Water food web:Implications for evaluating trophodynamics and the flow of energy and contaminants. Deep Sea Research Part Ⅱ:Topical Studies in Oceanography, 2002, 49(22/23): 5131-5150. |
| [24] |
Fry B. Stable isotope ecology. New York: Springer, 2006.
|
| [25] |
Zhang ZH, Sun XQ et al. Preliminary investigation of branches and copepods in Lake Baiyangdian. Hebei Fisheries, 2019(1): 36-38, 57. [张子晗, 孙枭琼等. 白洋淀枝角类和桡足类初步调查. 河北渔业, 2019(1): 36-38, 57.] |
| [26] |
Cheng L. Analysis of water environment status of Lake Baiyangdian. Water Sciences and Engineering Technology, 2016(5): 50-52. [程磊. 白洋淀水环境现状分析. 水科学与工程技术, 2016(5): 50-52.] |
| [27] |
Meng M, Tian HF, Wu MQ et al. Evolution characteristics analysis of wetland landscape pattern based on Google Earth Engine platform:A case study on Baiyangdian. Journal of Yunnan University:Natural Sciences, 2019, 41(2): 416-424. [孟梦, 田海峰, 邬明权等. 基于Google Earth Engine平台的湿地景观空间格局演变分析:以白洋淀为例. 云南大学学报:自然科学版, 2019, 41(2): 416-424.] |
| [28] |
Zhang SZ, Li GB. The wet land ecological service function and value estimation of the Lake Baiyangdian wetland. South-to-North Water Transfers and Water Science & Technology, 2005, 3(4): 22-25. [张素珍, 李贵宝. 白洋淀湿地生态服务功能及价值估算. 南水北调与水利科技, 2005, 3(4): 22-25.] |
| [29] |
Dong LM, Liu GN. Phosphorus forms and its distribution characteristics in sediment cores of Baiyangdian lake. Journal of Agro-Environment Science,, 2011, 30(4): 711-719. [董黎明, 刘冠男. 白洋淀柱状沉积物磷形态及其分布特征研究. 农业环境科学学报, 2011, 30(4): 711-719.] |
| [30] |
Wang Y, Liu LS, Shu JM et al. Community structure of phytoplankton and the water quality assessment in Lake Baiyangdian. J Lake Sci, 2011, 23(4): 575-580. [王瑜, 刘录三, 舒俭民等. 白洋淀浮游植物群落结构与水质评价. 湖泊科学, 2011, 23(4): 575-580. DOI:10.18307/2011.0413] |
| [31] |
Wang YQ, Xue PY, Geng LP et al. Distribution characteristics of nitrogen and phosphorus in sediments-submerged macrophytes-water systems of Baiyangdian lake. Journal of Soil and Water Conservation, 2017, 31(3): 304-309. [王亚琼, 薛培英, 耿丽平等. 白洋淀沉积物-沉水植物-水系统氮、磷分布特征. 水土保持学报, 2017, 31(3): 304-309.] |
| [32] |
Chen WM, Huang XF, Zhou WP et al. Lake ecosystem observation methods. Beijing: China Environmental Science Press, 2005: 17-37. [陈伟明, 黄翔飞, 周万平等. 湖泊生态系统观测方法. 北京: 中国环境科学出版社, 2005: 17-37.]
|
| [33] |
Zhang H, Wu GG, Zhang H et al. Seasonal variations of stable isotopes in fish fauna from east lake dongting. Acta Hydrobiologica Sinica, 2013, 37(4): 796-798. [张欢, 吴功果, 张欢等. 东洞庭湖鱼类稳定同位素的季节变化. 水生生物学报, 2013, 37(4): 796-798.] |
| [34] |
Zhou FX, Chen JH eds. Atlas of freshwater micro-organisms and benthic animals. Beijing: Chemical Industry Press, 2011. [周凤霞, 陈剑虹. 淡水微型生物与底栖动物图谱. 北京: 化学工业出版社, 2011.]
|
| [35] |
Duan XH, Wang ZY, Xu MZ eds. Ecological evaluation of benthic animals and rivers. Beijing: Tsinghua University Press, 2010. [段学花, 王兆印, 徐梦珍. 底栖动物与河流生态评价. 北京: 清华大学出版社, 2010.]
|
| [36] |
Zhang H, Xiao XW, Wang YY et al. Spatial variation instable isotope signatures and trophic position of fish in Raohe River, Lake Poyang Basin. J Lake Sci, 2015, 27(6): 1004-1010. [张欢, 肖协文, 王玉玉等. 鄱阳湖流域饶河鱼类稳定同位素比值和营养级的空间变化. 湖泊科学, 2015, 27(6): 1004-1010. DOI:10.18307/2015.0603] |
| [37] |
Qi ML, Li N, Bai LC et al. Community structure of benthic fauna and its relationship with environmental factors in the upper reaches of Huangshui River. Journal of Nanjing Agricultural University, 2020, 43(1): 72-79. [其木乐, 李宁, 白露超等. 湟水河上游底栖动物群落结构及其与环境因子间的关系. 南京农业大学学报, 2020, 43(1): 72-79.] |
| [38] |
Zhang LL. Lake ecological model based on benthic-planktonic coupling food web[Dissertation]. Beijing: Beijing Normal University, 2013. [张璐璐.基于底栖-浮游耦合食物网的湖泊生态模型研究[学位论文].北京: 北京师范大学, 2013. ]
|
| [39] |
Editorial Board of Water and Wastewater Monitoring and Analysis Methods Ministry of Environmental Protection of the People's Republic of China eds. Water and Wastewater Monitoring and Analysis Methods. 4th edition. Beijing: China Environmental Science Press, 2002. [国家环境保护总局《水和废水监测分析方法》编委会. 水和废水监测分析方法: 第4版. 北京: 中国环境科学出版社, 2002.]
|
| [40] |
Xie Q, Xu QQ, Wang YM et al. Stable isotope value and trophic position of fishes in Three Gorges Reservoir and Chang shou Reservoir. J Lake Sci, 2019, 31(3): 837-845. [谢青, 徐勤勤, 王永敏等. 三峡水库与长寿湖水库鱼类碳、氮稳定同位素特征及营养级的比较. 湖泊科学, 2019, 31(3): 837-845. DOI:10.18307/2019.0321] |
| [41] |
Jepsen DB, Winemiller KO. Structure of tropical river food webs revealed by stable isotope ratios. Oikos, 2002, 96(1): 46-55. DOI:10.1034/j.1600-0706.2002.960105.x |
| [42] |
Post DM. Using stable isotopes to estimate trophic position:models, methods, and assumptions. Ecology, 2002, 83(3): 703-718. DOI:10.1890/0012-9658(2002)083[0703:USITET]2.0.CO;2 |
| [43] |
Phillips D, Gregg J. Source partitioning using stable isotopes:Coping with too many sources. Oecologia, 2003, 136(2): 261-269. DOI:10.1007/s00442-003-1218-3 |
| [44] |
Tewfik A, Rasmussen JB, McCann KS. Anthrong pogenic enrichment alters a marine benthic food web. Ecology, 2005, 86: 2726-2736. DOI:10.1890/04-1537 |
| [45] |
Qian SS ed. Environmental and ecological statistics with R. Boca Raton: CRC Press, 2010.
|
| [46] |
Zanden MJV, Rasmussen JB. Primary consumer δ13C and δ15N and the trophic position of agquatic consumers. Ecology, 1999, 80(4): 1395-1404. DOI:10.1890/0012-9658(1999)080[1395:PCCANA]2.0.CO;2 |
| [47] |
Zanden MJV, Casselman JM, Rasmussen JB. Stable isotope evidence for the food web consequences of species invasions in lakes. Nature, 1999, 401(6752): 464-467. DOI:10.1038/46762 |
| [48] |
Ma QY, Han DY, Liu H et al. Construction of a continuous trophic spectrum for the food web in Jiaozhou bay using stable isotope analyses. Acta Ecologica Sinica, 2015, 35(21): 7207-7218. [麻秋云, 韩东燕, 刘贺等. 应用稳定同位素技术构建胶州湾食物网的连续营养谱. 生态学报, 2015, 35(21): 7207-7218. DOI:10.5846/stxb201310312632] |
| [49] |
Carlier A, Riera P, Amouroux JM et al. A seasonal survey of the food web in the Lapalme Lagoon (northwestern Mediterranean) assessed by carbon and nitrogen stable isotope analysis. Estuarine, Coastal and Shelf Science, 2007, 73(1/2): 299-315. |
| [50] |
Yasue N, Doiuchi R, Takasuka A. Trophodynamic similarities of three sympatric clupeoid species throughout their life histories in the Kii Channel as revealed by stable isotope approach. ICES Journal of Marine Science, 2014, 71(1): 44-55. DOI:10.1093/icesjms/fst128 |
| [51] |
Karube Z, Okada N, Tayasu I. Sulfur stable isotope signature identifies the source of reduced sulfur in benthic communities in macrophyte zones of Lake Biwa, Japan. Limnology, 2012, 13(3): 269-280. DOI:10.1007/s10201-012-0375-7 |
| [52] |
Song ZC, Zeng LX, He TR et al. Stable carbon and nitrogen isotope characteristics and structure of the food chain in Lake Caohai. Chinese Journal of Ecology, 2019, 38(3): 689-695. [宋正城, 曾玲霞, 何天容等. 草海湿地食物链稳定碳氮同位素特征与食物链结构. 生态学杂志, 2019, 38(3): 689-695.] |
| [53] |
Kendall C, Silva SR, Kelly VJ. Carbon and nitrogen isotopic compositions of particulate organic matter in four large river systems across the United States. Hydrological Proceses, 2010, 15(7): 1301-1346. |
| [54] |
Mariotti A. Denitrification in groundwaters, principles and methods for its identification:A review. Journal of Hydrology, 1986, 88: 1-23. DOI:10.1016/0022-1694(86)90194-0 |
| [55] |
Kendall C, Aravena R eds. Nitrate isotopes in groundwater systems. Boston:Klumer Academic Publishers, 2000, 261-297. |
| [56] |
Xu LS, Wu JL. Lake environmental characteristics recoreded by isotopes in sediments of dapu area in lake. Marine Geology & Quaternary Geology, 2013, 33(2): 137-142. [徐龙生, 吴敬禄. 太湖大浦湖区环境变化的沉积物同位素响应特征. 海洋地质与第四纪地质, 2013, 33(2): 137-142.] |
| [57] |
Xiao XW, Wang YY, Zhang H et al. Trophic position and its impact on fish in Raohe River during the dry season, Jiangxi Province. Acta Ecologica Sinica, 2015, 35(18): 6216-6223. [肖协文, 王玉玉, 张欢等. 饶河枯水期主要鱼类营养级位置及其影响因素. 生态学报, 2015, 35(18): 6216-6223.] |
| [58] |
Anderson C, Cabana G. Estimating the trophic position of aquatic consumers in river food webs using stable nitrogen isotopes. Journal of the North American Benthological Society, 2007, 26(2): 273-285. DOI:10.1899/0887-3593(2007)26[273:ETTPOA]2.0.CO;2 |
| [59] |
Xu J. Ecological studies on the food web structures and trophic relationships of freshwater lakes in China using stable carbon and nitrogen isotopes[Dissertation]. Wuhan: Institute of Hydrobiology, Chinese Academy of Sciences, 2005. [徐军.应用碳、氮稳定性同位素探讨淡水湖泊的食物网结构和营养级关系[学位论文].武汉: 中国科学院水生生物研究所, 2005. ]
|
| [60] |
Diao YM. Analysis of carbon and nitrogen stable isotope of particulate organic matters and plankton in South Yellow Sea in summer[Dissertation]. Qingdao: Ocean University of China, 2015. [刁明亚.夏季南黄海海域颗粒有机物和浮游生物的碳、氮稳定同位素分析[学位论文].青岛: 中国海洋大学, 2015. ]
|
| [61] |
Ho uW, Sun SH, Gu BH et al. Stable isotopes of zooplankton and their applications in the research of aquatic Ecosystems. Chinese Journal of Applied Ecology, 2019, 30(6): 1807-1814. [侯伟, 孙韶华, 古滨河等. 浮游动物稳定碳、氮同位素特征及其在水生态系统研究中的应用. 应用生态学报, 2019, 30(6): 1807-1814.] |
| [62] |
Sha YC, Zhang PY, Zhang H et al. Impacts of habitat environment on trophic niches of a local population:a case study of yellow catfish. Acta Ecologica Sinica, 2015, 35(5): 1321-1328. [沙永翠, 张培育, 张欢等. 栖息地环境对种群营养生态位的影响——以黄颡鱼为例. 生态学报, 2015, 35(5): 1321-1328.] |
| [63] |
Liu YL, Xu H, Xu J et al. Stable nitrogen isotope in aquatic macrophytes as an indicator of anthropogenic nitrogen inputs to Lake Taihu. J Lake Sci, 2015, 27(2): 243-249. [刘勇丽, 余辉, 徐军等. 利用水生植物氮同位素作为人为氮输入太湖的生物指标. 湖泊科学, 2015, 27(2): 243-249. DOI:10.18307/2015.0207] |
| [64] |
Xu J, Li S, Xie P. Differences in δ13C and δ15N of particulate organic matter from the deep oligotrophic lake Fuxian connected with the shallow eutrophic Lake Xingyun, People's Republic of China. Bulletin of Environmental Contamination and Toxicology, 2005, 74(2): 281-285. |
| [65] |
Liang H. Study on geographical distribution characteristics of carbon and nitrogen stable isotopes and elemental of lake primary producers and zooplankton in Eastern[Dissertation]. Kunming: Yunnan Normal University, 2019. [梁红.滇东湖泊水生植物和浮游生物碳、氮稳定同位素与元素的地理分布特征研究[学位论文].昆明: 云南师范大学, 2019. ]
|
| [66] |
Yang L, Li H eds. The wetland in Yunnan. Beijing: China Forestry Publishing House, 2010: 27, 596. [杨岚, 李恒. 云南湿地. Beijing: China Forestry Publishing House, 2010: 27, 596.]
|
| [67] |
France RL. Differentiation between littoral and pelagic food webs in lakes using stable carbon isotopes. Limnology and Oceanography, 1995, 40(7): 1310-1313. DOI:10.4319/lo.1995.40.7.1310 |
| [68] |
Deines P. The carbon isotopic composition of diamonds:Relationship to diamond shape, color, occurrence and vapor composition. Geochimica et Cosmochimica Acta, 1980, 44(7): 943-961. DOI:10.1016/0016-7037(80)90284-7 |
 2020, Vol. 32

