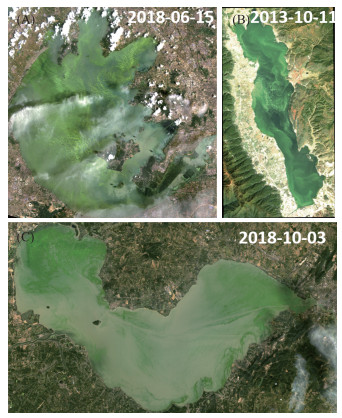
蓝藻水华(cyanobacterial bloom,简称藻华)被公认为全球最严重的湖泊水环境问题之一[1],其主要危害包括三类:第一,蓝藻在水面聚集影响湖泊的整体景观,并释放难闻气味;第二,大量蓝藻富集能耗尽水中的溶解氧、阻挡光的向下传输路径,挤占其它水生生物的生存空间;第三,产生的蓝藻毒素(cyanotoxins)能直接影响鱼类及人畜的健康[2]. 蓝藻能通过改变自身浮力来调整其水深分布[3],因而在水平与垂直空间上,都可能呈现显著的异质性. 因此在藻华暴发时,现场船舶调查通常难以全面捕获水华影响范围等关键信息. 卫星遥感具有大范围、周期性观测等特点,正好能弥补常规手段的不足,从而实现藻华的暴发范围、程度、持续时间等信息的快速准确获取[4-5],如图 1所示.

|
图 1 Landsat 8 OLI真彩色合成影像显示太湖(A)、洱海(B)与巢湖(C)的蓝藻水华暴发(湖泊中绿色为蓝藻水华暴发区) Fig.1 Landsat 8 OLI true color composite for Lake Taihu (A), Lake Erhai (B) and Lake Chaohu (C) show cyanobacterial blooms (greenish slicks) |
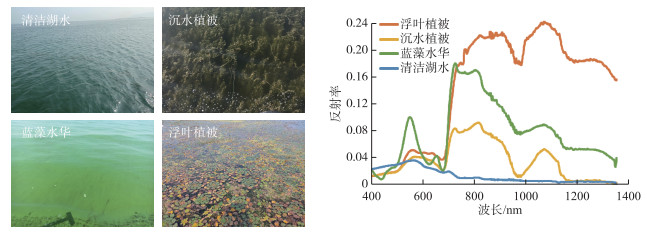
大量浮游藻类在水体表面聚集并能被卫星遥感识别的主要理论依据是:一方面,叶绿素在绿光波段存在反射峰,绿光波段在可见光范围反射最强,藻华将水体染成墨绿色(图 1);另外,藻华暴发时水体在近红外波段(near-infrared)反射较强,使得藻华水体具有陆地植被类似的红边(red edge)反射特征[6](图 2). 因此从理论上来讲,通过基于单一波段的反射率或构建相关的光谱指数,就能较好地对藻华区域进行判别. 目前,被常用于蓝藻水华识别的光谱指数包括近红外/绿光比值指数[7]、归一化植被指数(normalized difference vegetation index, NDVI [8])、最大叶绿素指数(maximum chlorophyll index, MCI[9])、浮藻指数(floating algae index, FAI[10])、蓝藻指数(cyanobacteria index, CI[11])等. 基于卫星遥感数据的研究对象包括单个湖泊[7-8, 12-15]、区域湖泊群[16-17],甚至全球尺度湖泊[18].

|
图 2 现场观测清洁湖水、水生植被(沉水植被与浮叶植被)和蓝藻水华的照片及对应光谱 Fig.2 Photos and hyperspectral measurements for clear lake water, aquatic vegetation (floating-leaved and submerged plants) and cyanobacterial bloom |
毋庸置疑,卫星遥感提供了一种高效、低成本的蓝藻水华监测手段,但是在实际应用过程中,笔者提出以下4个应当注意的关键问题.
1 水体在绿光及近红外波段的高反射信号并非一定来源于蓝藻水华清澈的非水华水体颜色也可能呈现墨绿色,即在可见光谱段上绿光波段反射率高于蓝、红波段. 例如,对于周围有青山或森林的湖库,绿色植被信号可能通过水面的镜面反射或漫反射进入传感器,呈现我们常见的“碧”波粼粼的景观. 此外,对于富含矿物质的湖泊,因离子(例如钙离子、碳酸氢根离子等)存在会改变水下光的吸收散射特性[19],进而产生各种不同的颜色(例如青藏高原部分湖泊、美国黄石公园的大棱镜泉等). 近年,国内外学者使用水体颜色(例如FUI颜色分级方法)对水体的富营养化开展了较多的研究[20-22],然而对上述两个问题目前还没有关注,更缺乏有效的解决方案.
湖泊(特别是浅水湖泊)受河流输入、底部再悬浮等过程影响,水体悬浮泥沙浓度呈现显著时空动态差异. 然而,泥沙的强后向散射信号会导致高浑浊水体在近红外波段的反射率升高[23-24]. 因此,基于单一近红外反射率阈值法只适用于悬浮泥沙浓度较低的水体(例如波罗的海[25]). 然而,2019年《自然》杂志一篇文章将单波段算法应用到全球71个湖泊[18],悬浮泥沙浓度的强反射会被误判为水华信号,导致藻华过程的严重高估. 此外,因为湖泊悬浮泥沙等其他光敏参数的浓度变化会改变整个反射率光谱曲线的形状及大小,从而使得藻华指数(如MCI、FAI等)的最佳判别阈值在不同湖泊甚至相同湖泊不同时间存在较大差异[12].
对于水生植被茂盛的湖泊而言,植被光谱在形状与反射率大小上都同藻华相似,单独使用前面提到的光谱指数难以将两者进行有效区分(图 2),需要借助多种指数[26]或植被空间分布的先验知识[12]. 特别的是,蓝藻中的藻蓝蛋白(或藻蓝素,phycocyanin)在620 nm处存在独特的吸收峰,因此蓝藻与水生植被在该波段附近存在明显反射率差异(图 2),并可用于水生植被与水华的分类[6]. 然而,只有少数几个卫星传感器设置了620 nm波段(如欧空局的MERIS、OLCI或其他高光谱卫星传感器),限制了该方法的推广应用. 另外,水生植被因具有明显的物候生长周期,其生长位置在短时间(例如几个月)内变化较小,而蓝藻水华的空间分布因受环境影响呈现高动态变化特征. 因此,可以考虑结合水生植被与水华的物候差异,利用时序遥感数据对两者进行区分. 遗憾的是,如何有效排除水生植被干扰目前仍然是实现浅水湖泊水华高精度提取的难点问题.
2 在湖泊上空卫星获取的总信号不只来源于水体本身卫星的入瞳(星上)信号(top-of-atmosphere,TOA)由地物(即水体)与大气两部分构成. 相比陆地而言,水体因对电磁波的强吸收而导致反射信号较弱[27],因此在卫星入瞳信号中占比较小. 浑浊湖泊水体信号在某些波长范围占卫星总信号的比例小于50 %,且比例随水体浑浊度变化. 大气对电磁波的吸收作用以及大气的瑞利散射(或称分子散射,Rayleigh scattering)能通过物理模型准确估算,但气溶胶散射(aerosol scattering)因其高时空异质性难以准确计算并被剔除[28].
前些年常用的MODIS、Landsat或者部分国产卫星数据并没有提供标准的大气校正产品,为了避免繁琐的大气校正过程,大量研究直接在星上反射率数据(甚至原始的灰度值)上进行水华范围提取[29-31]. 值得注意的是,在大气校正难以实现的情况下,水华提取算法设计上可以适当减小大气带来的误差. 例如,基于波段减法形式构建的算法(如FAI[10])可以部分抵消大气影响,并且因气溶胶散射在近红外和红波段较小,利用瑞利散射校正后的数据构建FAI能较好地应用于蓝藻水华提取. 而波段比值方法,特别是利用可见光构建的指数(如近红外/绿光[7])可能会放大大气程辐射带来的误差.
值得指出的是,基于水体的大气校正算法本身在内陆湖泊上存在精度低、有效数据少的问题;另外,水华大多会呈现类似陆地植被的光谱特征(图 2),进一步使得这些针对水体设计的系列大气校正算法失效[32-33]. 当然,如今MODIS、Landsat都提供了标准陆地大气校正产品[34-35],当斑块噪声不严重的情况下[36],此类产品也可以用于水华范围获取[37]. 另外,湖泊周边陆地信号也会通过大气散射到达卫星传感器,产生陆地邻近效应进而影响水华提取结果[38],因此一般建议将湖泊边界水域范围内3~5个像素进行掩膜处理[38].
3 基于卫星遥感的藻华时空变化趋势需谨慎解读卫星遥感能提供周期性重复的观测,经常被用于追溯湖泊蓝藻水华的历史发展趋势[8, 12, 17]. 然而,卫星遥感获取的长时序变化是否准确,需要考虑如下两个方面因素:(1)云覆盖(或雾霾)会显著减小光学遥感影像的有效观测频次. 例如,基于MODIS卫星数据统计的全球陆地平均云覆盖率约为55 % [39]. 因此,需要考虑有限观测数据获得的趋势过程是否真实?(2)一般而言,平静的湖面条件下蓝藻才能在水体表层富集形成水华并被遥感识别,而风速较大时会引起蓝藻在水柱中的垂向混合,使得表层蓝藻信号在遥感信号中不明显[11, 13]. 因此,风速的高动态变化特征势必会影响遥感获取的藻华暴发趋势,但影响程度如何尚需进一步研究.
基于以上两个方面问题,对于重访周期较长的卫星数据(例如Landsat),一年中仅有若干次有效观测,一般难以准确捕获湖泊藻华逐年变化的相关特征信息(例如面积、暴发时间等). 然而,国内外最近不少研究忽略了这些因素影响[18, 40]. 为了避免或解决此类问题,一方面可以选用藻华暴发频率(而非暴发频次或面积)作为变化趋势的研究对象,能适当减小部分干扰[15, 17, 25];另一方面,利用高时间分辨率的遥感数据或多源遥感数据融合,提高观测频率,从根本上提高遥感藻华趋势信息的可信度[41-42].
4 水体叶绿素浓度在藻华暴发时难以通过遥感准确定量反演叶绿素浓度是表征水体浮游植物丰度或富营养化的重要指标,因此卫星遥感也被广泛用于叶绿素浓度的定量反演,进而表征湖泊水华的严重程度. 水体叶绿素浓度反演的理论基础是利用叶绿素在蓝光(443 nm)与红光(675 nm)波段的强吸收特征[43],虽然对于清洁与浑浊水体的遥感波段选择上存在差异. 然而在藻华形成后,蓝藻因能改变浮力使其在水体中的垂直分布不均一[44],而卫星得到的信号只是水体表层. 另一方面,叶绿素浓度或蓝藻细胞密度在船舶的两侧都存在几倍甚至一个数量级以上的差异[45],而在遥感影像一个像素范围内的水平与垂直异质性更是无法估计. 因此,基于少数几个站点获取的实测水样构建的定量反演模型难以有效表征蓝藻水华的各种异质性特征,从而无法准确获取叶绿素浓度信息. 所以一般而言,不建议利用卫星遥感进行藻华暴发区域的叶绿素浓度定量反演. 当然,在这种情况下,叶绿素浓度一般都超过了100 μg/L,水体呈严重富营养化的情况下再通过遥感提供一个不准确的叶绿素浓度数值也完全没有必要.
5 结语在全球变暖的大背景下[46],湖泊温度升高会进一步促进藻类的生长,湖泊蓝藻水华未来几十年内可能仍会呈增加趋势[44, 47]. 此外,工农业点面源污染增加会进一步导致水体营养物质的增加[48],从而加剧湖泊蓝藻水华问题[49]. 因此在未来相当长一段时间内,我们仍需要借助遥感技术手段准确获取蓝藻水华的实时动态信息. 上述的4个问题在实际应用中可能不会全部存在,但在选用合适的遥感数据源与模型方法之前,建议先对它们的潜在影响进行评估.
| [1] |
Brooks BW, Lazorchak JM, Howard MDA et al. Are harmful algal blooms becoming the greatest inland water quality threat to public health and aquatic ecosystems?. Environmental Toxicology and Chemistry, 2016, 35(1): 6-13. DOI:10.1002/etc.3220 |
| [2] |
Carmichael WW. The toxins of cyanobacteria. Scientific American, 1994, 270(1): 78-86. DOI:10.1038/scientificamerican0194-78 |
| [3] |
Walsby AE, Hayes PK, Boje R et al. The selective advantage of buoyancy provided by gas vesicles for planktonic cyanobacteria in the Baltic Sea. New Phytologist, 1997, 136(3): 407-417. DOI:10.1046/j.1469-8137.1997.00754.x |
| [4] |
Kutser T, Metsamaa L, Strömbeck N et al. Monitoring cyanobacterial blooms by satellite remote sensing. Estuarine, Coastal and Shelf Science, 2006, 67(1/2): 303-312. DOI:10.1016/j.ecss.2005.11.024 |
| [5] |
Qin BQ, Yang GJ, Ma JR et al. Dynamics of variability and mechanism of harmful cyanobacteria bloom in Lake Taihu, China. Chinese Science Bulletin, 2016, 61(7): 759-770. [秦伯强, 杨桂军, 马健荣等. 太湖蓝藻水华"暴发"的动态特征及其机制. 科学通报, 2016, 61(7): 759-770. DOI:10.1360/N972015-00400] |
| [6] |
Matthews MW, Bernard S, Robertson L. An algorithm for detecting trophic status (chlorophyll-a), cyanobacterial-dominance, surface scums and floating vegetation in inland and coastal waters. Remote Sensing of Environment, 2012, 124: 637-652. DOI:10.1016/j.rse.2012.05.032 |
| [7] |
Duan HT, Zhang SX, Zhang YZ. Cyanobacteria bloom monitoring with remote sensing in Lake Taihu. J Lake Sci, 2008, 20(2): 145-152. [段洪涛, 张寿选, 张渊智. 太湖蓝藻水华遥感监测方法. 湖泊科学, 2008, 20(2): 145-152. DOI:10.18307/2008.0202] |
| [8] |
Duan HT, Ma RH, Xu XF et al. Two-decade reconstruction of algal blooms in China's Lake Taihu. Environmental Science & Technology, 2009, 43(10): 3522-3528. DOI:10.1021/es8031852 |
| [9] |
Gower J, King S, Goncalves P. Global monitoring of plankton blooms using MERIS MCI. International Journal of Remote Sensing, 2008, 29(21): 6209-6216. DOI:10.1080/01431160802178110 |
| [10] |
Hu CM. A novel ocean color index to detect floating algae in the global oceans. Remote Sensing of Environment, 2009, 113(10): 2118-2129. DOI:10.1016/j.rse.2009.05.012 |
| [11] |
Wynne TT, Stumpf RP, Tomlinson MC et al. Characterizing a cyanobacterial bloom in western Lake Erie using satellite imagery and meteorological data. Limnology and Oceanography, 2010, 55(5): 2025-2036. DOI:10.4319/lo.2010.55.5.2025 |
| [12] |
Hu C, Lee Z, Ma R et al. Moderate Resolution Imaging Spectroradiometer (MODIS) observations of cyanobacteria blooms in Taihu Lake, China. Journal of Geophysical Research: Oceans, 2010, 115(C4): C04002. DOI:10.1029/2009JC005511 |
| [13] |
Binding CE, Greenberg TA, McCullough G et al. An analysis of satellite-derived chlorophyll and algal bloom indices on Lake Winnipeg. Journal of Great Lakes Research, 2018, 44(3): 436-446. DOI:10.1016/j.jglr.2018.04.001 |
| [14] |
Michalak AM, Anderson EJ, Beletsky D et al. Record-setting algal bloom in Lake Erie caused by agricultural and meteorological trends consistent with expected future conditions. PNAS, 2013, 110(16): 6448-6452. DOI:10.1073/pnas.1216006110 |
| [15] |
Lu WK, Yu LX, Ou XK et al. Relationship between occurrence frequency of cyanobacteria bloom and meteorological factors in Lake Dianchi. J Lake Sci, 2017, 29(3): 534-545. [鲁韦坤, 余凌翔, 欧晓昆等. 滇池蓝藻水华发生频率与气象因子的关系. 湖泊科学, 2017, 29(3): 534-545. DOI:10.18307/2017.0302] |
| [16] |
Matthews MW. Eutrophication and cyanobacterial blooms in South African inland waters: 10 years of MERIS observations. Remote Sensing of Environment, 2014, 155: 161-177. DOI:10.1016/j.rse.2014.08.010 |
| [17] |
Mishra S, Stumpf RP, Schaeffer BA et al. Measurement of cyanobacterial bloom magnitude using satellite remote sensing. Scientific Reports, 2019, 9(1): 18310. DOI:10.1038/s41598-019-54453-y |
| [18] |
Ho JC, Michalak AM, Pahlevan N. Widespread global increase in intense lake phytoplankton blooms since the 1980s. Nature, 2019, 574(7780): 667-670. DOI:10.1038/s41586-019-1648-7 |
| [19] |
Li XH, Zhang MQ, Xiao WY et al. The color formation mechanism of the blue Karst lakes in Jiuzhaigou nature reserve, Sichuan, China. Water, 2020, 12(3): 771. DOI:10.3390/w12030771 |
| [20] |
Wang SL, Li JS, Zhang B et al. Trophic state assessment of global inland waters using a MODIS-derived Forel-Ule index. Remote Sensing of Environment, 2018, 217: 444-460. DOI:10.1016/j.rse.2018.08.026 |
| [21] |
Chen Q, Huang MT, Tang XD. Eutrophication assessment of seasonal urban lakes in China Yangtze River Basin using Landsat 8-derived Forel-Ule index: A six-year (2013-2018) observation. Science of the Total Environment, 2020, 745: 135392. DOI:10.1016/j.scitotenv.2019.135392 |
| [22] |
Malthus TJ, Ohmsen R, van der Woerd HJ. An evaluation of citizen science smartphone apps for inland water quality assessment. Remote Sensing, 2020, 12(10): 1578. DOI:10.3390/rs12101578 |
| [23] |
Nechad B, Ruddick KG, Park Y. Calibration and validation of a generic multisensor algorithm for mapping of total suspended matter in turbid waters. Remote Sensing of Environment, 2010, 114(4): 854-866. DOI:10.1016/j.rse.2009.11.022 |
| [24] |
Zhang YL. Progress and prospect in lake optics: A review. J Lake Sci, 2011, 23(4): 483-497. [张运林. 湖泊光学研究进展及其展望. 湖泊科学, 2011, 23(4): 483-497. DOI:10.18307/2011.0401] |
| [25] |
Kahru M, Elmgren R. Multidecadal time series of satellite-detected accumulations of cyanobacteria in the Baltic Sea. Biogeosciences, 2014, 11(13): 3619-3633. DOI:10.5194/bg-11-3619-2014 |
| [26] |
Li JS, Wu D, Wu YF et al. Identification of algae-bloom and aquatic macrophytes in Lake Taihu from in situ measured spectra data. J Lake Sci, 2009, 21(2): 215-222. [李俊生, 吴迪, 吴远峰等. 基于实测光谱数据的太湖水华和水生高等植物识别. 湖泊科学, 2009, 21(2): 215-222. DOI:10.18307/2009.0209] |
| [27] |
Curcio JA, Petty CC. The near infrared absorption spectrum of liquid water. Journal of the Optical Society of America, 1951, 41(5): 302. DOI:10.1364/josa.41.000302 |
| [28] |
Gordon HR. Atmospheric correction of ocean color imagery in the Earth Observing System era. Journal of Geophysical Research: Atmospheres, 1997, 102(D14): 17081-17106. DOI:10.1029/96JD02443 |
| [29] |
Nai ZJ, Duan HT, Zhu L et al. A novel algorithm to monitor cyanobacterial blooms in Lake Taihu from HJ-CCD imagery. J Lake Sci, 2016, 28(3): 624-634. [佴兆骏, 段洪涛, 朱利等. 基于环境卫星CCD数据的太湖蓝藻水华监测算法研究. 湖泊科学, 2016, 28(3): 624-634. DOI:10.18307/2016.0319] |
| [30] |
Zhang J, Chen LQ, Chen XL. Monitoring the cyanobacterial blooms based on remote sensing in Lake Erhai by FAI. J Lake Sci, 2016, 28(4): 718-725. [张娇, 陈莉琼, 陈晓玲. 基于FAI方法的洱海蓝藻水华遥感监测. 湖泊科学, 2016, 28(4): 718-725. DOI:10.18307/2016.0404] |
| [31] |
Zhang M, Kong FX. The process, spatial and temporal distributions and mitigation strategies of the eutrophi-cation of Lake Chaohu(1984-2013). J Lake Sci, 2015, 27(5): 791-798. [张民, 孔繁翔. 巢湖富营养化的历程、空间分布与治理策略(1984-2013年). 湖泊科学, 2015, 27(5): 791-798. DOI:10.18307/2015.0505] |
| [32] |
Wang MH, Shi W. The NIR-SWIR combined atmospheric correction approach for MODIS ocean color data processing. Optics Express, 2007, 15(24): 15722-15733. DOI:10.1364/OE.15.015722 |
| [33] |
Vanhellemont Q, Ruddick K. Advantages of high quality SWIR bands for ocean colour processing: Examples from Landsat-8. Remote Sensing of Environment, 2015, 161: 89-106. DOI:10.1016/j.rse.2015.02.007 |
| [34] |
Vermote E, Justice C, Claverie M et al. Preliminary analysis of the performance of the Landsat 8/OLI land surface reflectance product. Remote Sensing of Environment, 2016, 185: 46-56. DOI:10.1016/j.rse.2016.04.008 |
| [35] |
Vermote EF, Vermeulen A. Atmospheric correction algorithm: spectral reflectances (MOD09). Algorithm Technical Background Document, 1999(4): 107. |
| [36] |
Feng L, Hu CM, Li JS. Can MODIS land reflectance products be used for estuarine and inland waters?. Water Resources Research, 2018, 54(5): 3583-3601. DOI:10.1029/2017WR021607 |
| [37] |
Shang LL, Ma RH, Duan HT et al. Scale analysis of cyanobacteria bloom in Lake Taihu from MODIS observations. J Lake Sci, 2011, 23(6): 847-854. [尚琳琳, 马荣华, 段洪涛等. 利用MODIS影像提取太湖蓝藻水华的尺度差异性分析. 湖泊科学, 2011, 23(6): 847-854. DOI:10.18307/2011.0604] |
| [38] |
Feng L, Hu CM. Land adjacency effects on MODIS Aqua top-of-atmosphere radiance in the shortwave infrared: Statistical assessment and correction. Journal of Geophysical Research: Oceans, 2017, 122(6): 4802-4818. DOI:10.1002/2017JC012874 |
| [39] |
King MD, Platnick S, Menzel WP et al. Spatial and temporal distribution of clouds observed by MODIS onboard the Terra and aqua satellites. IEEE Transactions on Geoscience and Remote Sensing, 2013, 51(7): 3826-3852. DOI:10.1109/TGRS.2012.2227333 |
| [40] |
Yue A, Zeng QW, Wang HJ. Remote sensing long-term monitoring of cyanobacterial blooms in Yuqiao Reservoir. Remote Sensing Technology and Application, 2020, 35(3): 694-701. [岳昂, 曾庆伟, 王怀警. 于桥水库蓝藻水华遥感长时序监测研究. 遥感技术与应用, 2020, 35(3): 694-701.] |
| [41] |
Qi L, Hu CM, Visser PM et al. Diurnal changes of cyanobacteria blooms in Taihu Lake as derived from GOCI observations. Limnology and Oceanography, 2018, 63(4): 1711-1726. DOI:10.1002/lno.10802 |
| [42] |
Wang M, Zheng W, Liu C. Application of Himawari-8 data with high-frequency observation for Cyanobacteria bloom dynamically monitoring in Lake Taihu. J Lake Sci, 2017, 29(5): 1043-1053. [王萌, 郑伟, 刘诚. 利用Himawari-8高频次监测太湖蓝藻水华动态. 湖泊科学, 2017, 29(5): 1043-1053. DOI:10.18307/2017.0502] |
| [43] |
Matthews MW. A current review of empirical procedures of remote sensing in inland and near-coastal transitional waters. International Journal of Remote Sensing, 2011, 32(21): 6855-6899. DOI:10.1080/01431161.2010.512947 |
| [44] |
Paerl HW, Paul VJ. Climate change: Links to global expansion of harmful cyanobacteria. Water Research, 2012, 46(5): 1349-1363. DOI:10.1016/j.watres.2011.08.002 |
| [45] |
Kutser T. Quantitative detection of chlorophyll in cyanobacterial blooms by satellite remote sensing. Limnology and Oceanography, 2004, 49(6): 2179-2189. DOI:10.4319/lo.2004.49.6.2179 |
| [46] |
Medhaug I, Stolpe MB, Fischer EM et al. Reconciling controversies about the 'global warming hiatus'. Nature, 2017, 545(7652): 41-47. DOI:10.1038/nature22315 |
| [47] |
Wells ML, Trainer VL, Smayda TJ et al. Harmful algal blooms and climate change: Learning from the past and present to forecast the future. Harmful Algae, 2015, 49: 68-93. DOI:10.1016/j.hal.2015.07.009 |
| [48] |
Zhu GW, Xu H, Zhu MY et al. Changing characteristics and driving factors of trophic state of lakes in the middle and lower reaches of Yangtze River in the past 30 years. J Lake Sci, 2019, 31(6): 1510-1524. [朱广伟, 许海, 朱梦圆等. 三十年来长江中下游湖泊富营养化状况变迁及其影响因素. 湖泊科学, 2019, 31(6): 1510-1524. DOI:10.18307/2019.0622] |
| [49] |
Wang ZW. China's wastewater treatment goals. Science, 2012, 338(6107): 604. DOI:10.1126/science.338.6107.604-a |
 2021, Vol. 33

