(2: 贵州师范大学高原湿地生态与环境研究中心, 贵阳 550001)
(2: Plateau Wetland Ecology and Environment Research Center, Guizhou Normal University, Guiyang 550001, P. R. China)
周丛生物(periphyton)又名着生生物或者周丛藻类,主要由光自养微藻、细菌、真菌、原生动物、多细胞动物、有机或无机碎屑等组成[1-2],是地表水生态系统重要的组成部分[3-5]. 周丛生物通过对初级生产和食物链的影响[6],驱动着水体和沉积物中大多数元素的生物地球化学循环[7]. 例如,周丛生物在水体氮磷去除[8]、重金属富集等方面发挥着重要作用[5, 9],逐渐被应用于水体净化和水环境监测[10]. 但是人类生产活动中营养物质的过度排放,导致了全球31 % 的陆地集水区中周丛生物的大量生长,其中近四分之三(76 %)是因磷富集所引起的[1],对水生生态系统造成严重的有害影响[11-13]. 因此,周丛生物已成为国内外研究人员关注的一个热点[4-5, 14-15].
生态化学计量学(ecological stoichiometry)是以研究碳(C)、氮(N)、磷(P)为主的元素质量平衡对生态交互作用影响的一种理论[16],周丛生物化学计量比可反映水体中营养物质的可用性[17],对水体营养状况具有重要的指示意义[18]. 近年来,国内外学者通过研究周丛生物来指示河流[19]、湖泊[20]和湿地[21]等典型生态环境的变化特征. Godwin等研究发现河流中周丛生物含有大量的N、P元素,在被冲刷到下游累积时,会对当地水生态系统产生极大的威胁[22]. O'Brien等根据周丛生物化学计量学提出用梯度法来揭示关于土地利用对河流功能影响的建议[17]. 的确,周丛生物元素组成会随环境的改变而发生变化[23],上下游生境的变化间接影响水体营养元素的纵向变化[22],这将导致周丛生物计量比的变化. Schiller等研究发现西班牙东北部溪流中的周丛生物C:N主要受光照和氮源的影响,其中森林地区最高,城市地区为中等,农田地区最低[24]. 崔经国等对北京密云水库上下游河流中周丛生物化学计量研究发现,总磷(TP)是影响周丛生物生长的关键因素[18]. Drake等通过三维建模发现周丛生物C:P和光照可以控制周丛生物在富营养河流中磷的固定和释放[25]. 另外李九玉等指出周丛生物的生长凋落过程可调控水稻田中P元素的吸收和释放[4]. Hillebrand等根据周丛生物化学计量比提出了营养限制阈值(C:P>180且N:P> 22,为P限制;C:N>10且N:P < 13,为N限制[26]). 因此探究周丛生物生态化学计量学,对认识C、N、P元素在湿地生态系统中的循环和平衡机制具有参考价值. 化学计量内稳态是指生物体在不断变化的环境中维持自身元素含量和比率稳定的能力[16, 23],能够反映生物在面对复杂生存环境时的适应性[27]. 然而大多数研究主要关注水体营养与周丛生物化学元素之前循环的关系,对于周丛生物生长周期中内稳性变化特征的研究鲜有报道,水体总氮(TN)与TP是如何交互作用于周丛生物化学计量还不清楚. 因此明确周丛生物在不同生长阶段C、N、P含量和化学计量比变化的稳态性特征,以及水体TN与TP对于周丛生物化学计量的影响,将对于丰富水生态系统生态化学计量学理论具有重要意义.
贵州草海湿地常年受到周边人类生产生活排水的污染,近年来基于草海的研究主要集中于富营养化[28-30]和重金属[9, 31-32]等方面,对不同水位梯度下沉积物生态化学计量也有研究[33],然而周丛生物在水生态系统中的元素循环特征尚不清楚. 因此,本研究通过周丛生物化学计量的研究,以期揭示:(1)生长周期和不同生境对周丛生物化学计量及其稳态性特征的影响;(2)不同生境营养元素限制;(3)建立水体TP和TN及其交互作用与周丛生物化学计量的三维模型关系. 进而探究水体营养状况与周丛生物化学计量之间的养分循环规律,为湿地生态系统的恢复和管理提供理论依据.
1 材料与方法 1.1 研究区概况研究区(26°47′35″~26°52′10″N,104°9′23″~104°20′10″E)位于贵州省威宁县草海自然保护区,是天然喀斯特高原淡水湖泊湿地. 贵州草海属于山地亚热带高原季风气候,雨季为5-10月,年均降水量约为950.9 mm. 草海湿地是国家一级保护动物黑颈鹤(Grus nigricollis) 主要的越冬栖息地之一,但其生态系统受到人为活动的影响趋于退化[28-29]. 近几年政府为加强对当地环境的保护,在湖区周边主要点源污染区修建了诸多污水处理厂和人工湿地. 其中,污水处理厂采用设备净化和表层潜流植被净化相结合的工程措施,人工湿地是以多个生态塘连接自然净化为主. 本次采样将以草海天然湖滨带以及周边受人类活动影响较大的农田区、污水处理厂和人工湿地4种不同生境为研究对象.
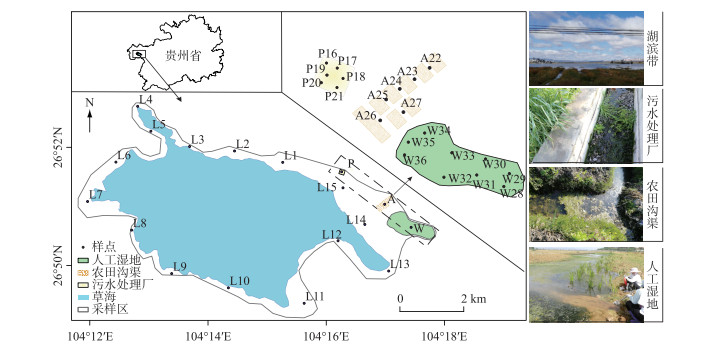
1.2 样品采集与处理于2019年4月中旬,分别在贵州草海湿地湖滨带、污水处理厂、农田沟渠和人工湿地布设采样点36个. 湖滨带采样点间隔3 km左右,共计15个;污水处理厂净化池6个;农田沟渠6个;人工湿地9个(图 1). 在水体表面0.1~0.3 m处开敞水域使用镊子和尼龙刷采集周丛生物,每个样点布设3处0.3 m×0.3 m样方,收集3次重复并充分混合,根据周丛生物形态特征区分其生长周期(周丛生物大部由丝状藻类组成,生长初期,色泽嫩绿至草绿,未构成完整的团聚体. 至衰老期,颜色深绿,结构复杂,为团聚体),对于野外无法直接鉴定的周丛生物,后期通过光学显微镜鉴定分类. 共采集有效样本36个,其中生长期周丛生物16个,衰老期周丛生物20个. 样品用冰袋保存并及时送至-20℃冰箱保存待测,pH采用1:2.5电位法,溶解氧(DO)浓度和水温(T)采用便携式仪器(HQ30d HACH)现场测定. 根据《地表水环境质量标准》(GB 3838-2002)水质标准方法测定水体的理化性质,包括总氮(TN)、总磷(TP)、氨氮(NH3-N)、高锰酸盐指数(CODMn)和叶绿素a(Chl.a). 参考《土壤农业化学分析方法》[24]测定周丛生物指标,包括总有机碳(C)采用高温外加热重铬酸钾氧化-容量法,全氮(N)采用凯氏定氮法,全磷(P)采用SMT法.

|
图 1 采样点分布 Fig.1 Distribution of sampling sites |
本研究中周丛生物C:N、C:P、N:P均为质量比,内稳态指数(homeostasis index,H)根据方程式y=cx1/H计算[34]. 式中,y为周丛生物N、P含量或计量比,x为水体TN、TP含量或计量比,H为内稳态指数,c为积分常数. 参照Persson等的分类[34],把H < 1.33、1.33 < H < 2、2 < H < 4、H>4依次归类为敏感态、弱敏感态、弱稳态和稳态.
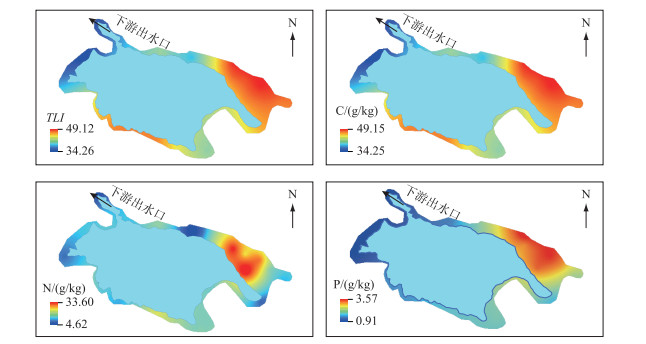
采样图采用ArcGIS 10.6绘制,实验数据使用Microsoft Excel 2016进行整理. 水体营养指数参考卡尔森综合营养指数法(TLI),以CODMn、Chl.a、TN、TP浓度4个参数进行权重计算,使用ArcGIS克里金插值法分析采样区水质及周丛生物C、N、P含量的分布情况. 使用SPSS 22进行数据的统计分析,根据单因素方差分析研究差异显著性,根据双因素方差分析比较生境和生长周期对周丛生物化学计量的影响差异. 使用R语言对周丛生物化学计量与水体理化指标做Pearson相关性分析,采用Mantel测试,探讨不同生长周期周丛生物N、P、N:P内稳态指数和周丛生物化学计量与水体理化指标之间的关系. 最后通过Origin 2018软件对周丛生物化学计量与水体理化指标(TN、TP浓度)进行非线性曲面拟合分析,进而根据三维模型分析TP、TN浓度及其交互作用对周丛生物化学计量的影响. 在分析前对数据进行对数转换,使其符合正态分布.
2 结果与分析 2.1 水体理化指标4个采样区中水体平均温度为15℃,pH值均值范围为6.41~7.91,呈现中性. 其余物理化学性质在4个生境间差异较大,且各区域内部水质变化也较大,尤其以NH3-N、Chl.a、TP、TN的变异系数最大(表 1). 污水处理厂的TP((0.45±0.34)mg/L)和TN((6.52±3.43)mg/L)浓度最高,湖滨带的TP((0.14±0.28)mg/L)和TN((1.23±0.64)mg/L)浓度最低. TLI从大到小依次为:污水处理厂(51.55±4.50)>农田沟渠(50.41±4.50)>人工湿地(47.20±6.72)>湖滨带(41.86±6.91),大体呈现由上游到下游水质变好的趋势(图 2).
| 表 1 采样点水体理化指标* Tab. 1 Physical and chemical properties of water column in the sampling sites |

|
图 2 水体营养指数(TLI)和周丛生物C、N、P含量热图 Fig.2 Heat map of water column trophic level index (TLI) and C, N, P content of periphyton |
草海湿地周丛生物C、N、P含量分别在119.58~230.86、12.96~32.07、1.11~5.90 g/kg之间,C:N、N:P、C:P分别在3.93~16.03、2.99~15.92、24.99~181.66之间(图 3). 周丛生物C、N、P含量大体呈现从上游到下游递减的趋势(图 2). C、P含量在污水处理厂最高,N含量在农田沟渠最高. C、N含量在人工湿地最低,P含量在湖滨带最低. C:N、N:P、C:P均在湖滨带最高,N:P和C:P在污水处理厂最低,C:N在农田沟渠最低(图 3).

|
图 3 周丛生物C、N、P含量及化学计量比(图中不同小写字母表示在同一生境中不同生长周期之间具有显著差异性(P < 0.05),不同大写字母表示不同生境间具有显著差异性(P < 0.05)) Fig.3 C, N and P contents and stoichiometric ratio in periphyton (a, b, c represent significant differences in the same habitat(P < 0.05), and A, B, C represent significant differences between different habitats(P < 0.05)) |
在不同生境间,周丛生物元素含量和化学计量比差异显著(图 2, P < 0.05). 随着水体营养浓度的上升,周丛生物大致呈现出C、N、P含量升高、计量比下降的趋势. 仅人工湿地衰老期的周丛生物C含量显著低于其他区域;污水处理厂和农田沟渠的周聪生物N含量显著高于湖滨带和人工湿地;P元素波动最大,其中,生长期周丛生物P含量在污水处理厂高于湖滨带和人工湿地,衰老期周丛生物P含量在污水处理厂和农田沟渠显著高于湖滨带和人工湿地. 周丛生物C:P和C:N随着营养水平的升高反而降低,而N:P无显著变化. 污水处理厂和农田沟渠的周丛生物C:N显著低于湖滨带和人工湿地,湖滨带周丛生物C:P显著高于其他3个区域,周丛生物N:P在人工湿地和污水处理厂显著低于湖滨带和农田沟渠. 在相同生境中,不同生长周期的周丛生物C含量具有显著差异性(图 2a, P < 0.05),生长期周丛生物的C、N、P含量除在农田沟渠外均低于衰老期周丛生物,化学计量均无显著差异.
生境对周丛生物元素含量和化学计量比均有极显著的影响(P < 0.01),而生长周期仅对C、P含量和N:P有极显著影响(P < 0.01). 其中生境对N含量和C:N、C:P的影响大于生长周期,其余则相反,两者交互作用只对N:P有极显著的影响(P < 0.01)(表 2).
| 表 2 双因素方差分析检验生境、生长周期及两者交互作用对周丛生物化学计量的影响 Tab. 2 Two-way ANOVA to test the effects of habitat, growth stages and their interaction on the periphyton stoichiometry |
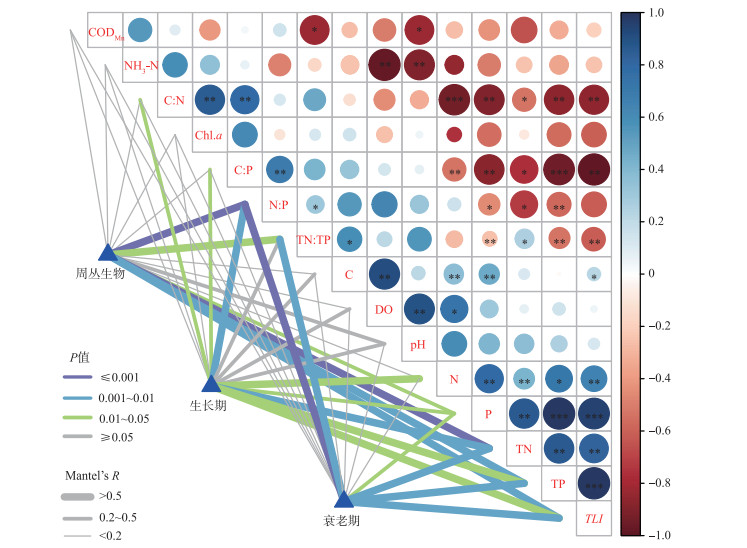
从表 3可以看出,周丛生物N、P、N:P的内稳态指数均大于1,生长期周丛生物N、P元素属于弱稳态类型(HP>2; HN < 4),衰老期周丛生物N、P元素属于稳态类型(HP、HN>4),N:P计量比均为稳态类型(HN:P>4). 说明衰老期周丛生物N、P元素的内稳性高于生长期周丛生物,而不同生长周期对于N:P内稳性的影响较小. 通过Mantel测试发现(图 4),N:P、TN:TP、TN浓度、TP浓度、TLI指数与周丛生物内稳态指数之间存在极显著正相关(Mantel's R>0.5, P < 0.01),与衰老期周丛生物的相关性强于生长期周丛生物. 另外,C:N、C:P、N含量、P含量仅与生长期周丛生物呈显著正相关(Mantel's R>=0.2, 0.01 < P < 0.05).
| 表 3 周丛生物不同生长周期化学计量内稳态指数* Tab. 3 Stoichiometric homeostasis index of periphyton at different growth stages |

|
图 4 水体理化指标、周丛生物化学计量与周丛生物生长期和衰老期内稳态指数(HN:P、HP和 HN) 的相关性(*代表P < 0.05,显著相关;* *代表P < 0.01,* * *代表P < 0.001,极显著相关) Fig.4 Correlation of water column physicochemical index, periphyton stoichiometry and homeostasis index (HN:P, HP and HN) in periphyton growth period and decline period (Asterisks indicate significant correlations, *P < 0.05, * *P < 0.01, * * *P < 0.001) |
水体理化指标和周丛生物化学计量关系的分析结果(图 4)显示,水体TLI指数、TP浓度、TN浓度与周丛生物N、P含量及化学计量比均有显著相关关系(P < 0.05),TLI指数与N:P除外(P>0.05),其中与N含量、P含量为正相关关系,与C:N、N:P、C:P为负相关关系. TN:TP与N:P呈显著正相关(P < 0.05). 说明水体理化指标中,TN和TP浓度可能是影响周丛生物元素含量化学计量比变化的主要因素. 另外,周丛生物C、N、P元素含量之间均为极显著正相关关系(P < 0.01),化学计量比之间仅N:P和C:N无显著相关性(P>0.05). 周丛生物N、P含量与化学计量比呈显著正相关关系(P < 0.05),N含量与N:P除外(P>0.05),而C含量与化学计量比之间均无显著相关性(P>0.05). 表明周丛生物元素中,N、P含量是影响其化学计量比变化的主要元素.
2.5 水体TN、TP浓度与周丛生物化学计量的关系对周丛生物的化学计量比与水体TN、TP浓度进行非线性曲面拟合(表 4, 图 5),采用最优方程. 当水体TP浓度升高时,C:P、N:P、C:N均随之降低,而当TN浓度升高时,只有C:N和C:P降低. N:P主要受TP浓度变化的影响(P=0.004),C:N则主要受控于TN浓度(P=0.01),TN和TP浓度对C:P的影响同等重要(P=0.004).
| 表 4 周丛生物计量比与水体TN、TP浓度的非线性曲面拟合 Tab. 4 The nonlinear surface fitting between the stoichiometry ratio of periphyton and TN, TP concentrations in water column |

|
图 5 周丛生物化学计量比对水体TN、TP浓度响应的三维模型 Fig.5 A three-dimensional model of the response of periphyton stoichiometry ratio to TN and TP concentrations in water column |
探究物种在变化的环境中保持元素动态平衡的能力是生态化学计量学的核心问题[35],主要是C、N、P[36]. 本研究发现,处于同一环境中的衰老期周丛生物元素含量均大于生长期周丛生物. 这是由于周丛生物的C含量主要源于藻类和细菌[37-39],而大量吸收和同化会导致C的积累[40],N元素主要来自藻类的同化作用[41],P元素以吸收和吸附为主[8]. 尽管衰老期周丛生物生长速率小于生长期周丛生物,但衰老期周丛生物生物量大、生长时间久,所以在相同环境中比生长期周丛生物的元素含量更高.
化学计量学内稳态机制认为生物能够在生态系统中保持自身元素组成的相对稳定[42]. Sterner等认为以自养藻类为主要成分的周丛生物,其化学计量内稳态较弱[23],但也有研究学者发现周丛生物具有一定程度的内稳性特征[43]. 本研究发现在4个不同的生境间,随着水体营养盐浓度的上升,周丛生物N、P元素含量也升高,而C元素含量无显著变化. 崔经国等的研究认为周丛生物C元素含量主要来自溶解于水体中的CO2,与水体中的有机质关联小[18],本文也发现周丛生物C含量与CODMn、TN、TP浓度等均无显著相关性. 基于此,本研究仅对N、P元素及N:P的内稳性进行分析,发现周丛生物的N:P保持良好的稳态型,而N、P元素在衰老期为稳态型,在生长期为弱稳态型. 表明周丛生物的N、P含量及其N:P在草海不同生境中基本符合化学计量内稳态机制. Persson等研究发现内稳态的程度与生物体内部(如生长状态)因素有一定关系,即藻类的稳态会随生长速率的增加而增强[34],说明不同生长周期会对周丛生物化学计量的稳态性造成影响. 本研究通过相关性分析发现,C:N、C:P和N、P含量仅与生长期周丛生物呈显著正相关(Mantel's R≥0.2, 0.01 < P < 0.05),这可能就是影响周丛生物在生长阶段稳态性变化的主要原因. 然而对于如何分析周丛生物C元素及其C:P、C:N的内稳性,目前尚不清楚.
3.2 周丛生物元素组成与水体营养水平之间的关系淡水周丛生物C:N:P的最佳化学计量比为119:17:1[43],与海洋周丛生物106:16:1非常接近[44]. O'Brien等研究发现周丛生物C:N波动范围较大,在4.4~12.5之间(均值7.6)[17]. Hillebrand等提出C:N处于5~10之间最适合藻类生长[43],后来又指出当C:P>180且N:P> 22时,为P限制; 当C:N>10且N:P < 13时,为N限制[26]. 本研究(进行了质量比和摩尔比之间的转换)发现4个生境都不存在N限制,而只有湖滨带处于P限制,其原因可能是其他3个区域都接受了不同程度的外源污染,包括农作物肥料污染[45]、生活污水的排放等,导致N、P污染严重. 而湖滨带受到人类活动影响最小,水体受污染程度也最低. 综上,污水处理厂、农田沟渠和人工湿地养分充足,N和P混合污染的风险较大.
化学计量特征是物种在生长过程中对其周边环境长期适应的结果,周丛生物的计量比可能由于生境的不同引起较大的变化[43, 46]. 本研究双因素方差分析(表 2)也表明生境对周丛生物的元素含量和化学计量比均呈显著影响(P < 0.05),大于生长周期所产生的影响. 崔经国等研究发现潮白河周丛生物元素含量和水体营养水平呈显著相关[18],高学平等进一步研究发现水体TN、TP浓度与周丛生物化学计量比之间通常是密切相关、相互耦合的[47],本研究结果与其一致. 相关分析表明,水体TLI指数、TP和TN浓度与周丛生物元素N、P含量及化学计量比呈显著的相关性(P < 0.05,图 4). 综上,水体营养状态的变化直接影响周丛生物化学计量的动态变化,其中主要因子是TP和TN浓度. 另外,有学者提出应该通过水体营养浓度和化学计量比之间的关系创建一个更清晰的周丛生物化学计量学模式[17, 48]. 本研究表明,基于水体TP、TN浓度和周丛生物化学计量比的三维模型(图 5),可评估水体营养水平和周丛生物化学计量之间的关系. 但是Stelzer等认为仅靠水体和周丛生物的养分比率来预测养分限制的方法可能会有局限性[48]. 因此,该模型还需在以后的研究中进一步深化.
周丛生物是草海湿地的主要初级生产力之一,其元素变化将通过食物链导致高级种群化学计量的变化. 因此合理控制水体TN、TP浓度对于维护草海生态系统的平衡至关重要. 但是目前还缺乏高一级生物群落的化学计量知识,有待进一步研究.
4 结论1) 周丛生物的N:P计量比为稳态型,而N、P元素在衰老期为稳态型,在生长期为弱稳态型.
2) 草海湖滨带处于P限制状态,人工湿地、污水处理厂和农田沟渠养分充足,元素含量呈现从上游到下游递减的趋势. 水体营养状态是影响周丛生物元素组成动态变化的主要因素,其中主要因子是水体TP和TN浓度.
3) 周丛生物N:P主要受水体TP浓度的影响,C:N则主要受水体TN浓度的影响,而水体TN和TP浓度对C:P的影响同等重要. 研究表明基于水体TN、TP浓度和周丛生物化学计量的三维模型可用来评估不同水体中营养元素限制.
| [1] |
McDowell RW, Noble A, Pletnyakov P et al. Global mapping of freshwater nutrient enrichment and periphyton growth potential. Scientific Reports, 2020, 10: 3568. DOI:10.1038/s41598-020-60279-w |
| [2] |
Larned ST. A prospectus for periphyton: Recent and future ecological research. Journal of the North American Benthological Society, 2010, 29(1): 182-206. DOI:10.1899/08-063.1 |
| [3] |
Lock MA, Wallace RR, Costerton JW et al. River epilithon: Toward a structural-functional model. Oikos, 1984, 42(1): 10-22. DOI:10.2307/3544604 |
| [4] |
Li JY, Deng KY, Cai SJ et al. Periphyton has the potential to increase phosphorus use efficiency in paddy fields. Science of the Total Environment, 2020, 720: 137711. DOI:10.1016/j.scitotenv.2020.137711 |
| [5] |
Battin TJ, Besemer K, Bengtsson MM et al. The ecology and biogeochemistry of stream biofilms. Nature Reviews Microbiology, 2016, 14(4): 251-263. DOI:10.1038/nrmicro.2016.15 |
| [6] |
Saikia SK. Review on periphyton as mediator of nutrient transfer in aquatic ecosystems. Ecologia Balkanica, 2011, 3(2): 65-78. |
| [7] |
Flemming HC, Wingender J, Szewzyk U et al. Biofilms: an emergent form of bacterial life. Nature Reviews Microbiology, 2016, 14(9): 563-575. DOI:10.1038/nrmicro.2016.94 |
| [8] |
Wu YH. Periphyton: Functions and application in environmental remediation. Elsevier, 2016, 137-157. |
| [9] |
Song X, Lin T, Xia PH et al. Algae composition and accumulation characteristics of heavy metals in epiphytic bioflioms of submerged macrophytes. J Lake Sci, 2019, 31(5): 1268-1278. [宋旭, 林陶, 夏品华等. 沉水植物附植生物膜藻类组成及重金属累积特征. 湖泊科学, 2019, 31(5): 1268-1278. DOI:10.18307/2019.0523] |
| [10] |
Furey PC, Deininger A, Liess A. Substratum-associated microbiota. Water Environment Research, 2016, 88(10): 1637-1671. DOI:10.2175/106143016x14696400495613 |
| [11] |
Bojsen BH, Jacobsen D. Effects of deforestation on macroinvertebrate diversity and assemblage structure in Ecuadorian Amazon streams. Archiv für Hydrobiologie, 2003, 158(3): 317-342. DOI:10.1127/0003-9136/2003/0158-0317 |
| [12] |
Cascallar L, Mastranduono P, Mosto P et al. Periphytic algae as bioindicators of nitrogen inputs in lakes. Journal of Phycology, 2003, 39(s1): 7-8. DOI:10.1111/j.0022-3646.2003.03906001_19.x |
| [13] |
Giorgi A, Malacalza L. Effect of an industrial discharge on water quality and periphyton structure in a pampeam stream. Environmental Monitoring and Assessment, 2002, 75(2): 107-119. DOI:10.1023/a:1014474128740 |
| [14] |
Sun CM, Shao JH, Kuang XL. Effects of dissolved organic matter on the adsorption characteristics of Cu(Ⅱ)by periphyton. Journal of Agro-Environment Science, 2020, 39(3): 648-655. [孙晨敏, 邵继海, 匡晓琳. 牛粪中溶解性有机质对周丛生物吸附Cu(Ⅱ)特性的影响. 农业环境科学学报, 2020, 39(3): 648-655. DOI:10.11654/jaes.2019-1135] |
| [15] |
Wu YH, Liu JZ, Lu HY et al. Periphyton: an important regulator in optimizing soil phosphorus bioavailability in paddy fields. Environmental Science and Pollution Research, 2016, 23(21): 21377-21384. DOI:10.1007/s11356-016-7363-0 |
| [16] |
Elser JJ, Sterner RW, Gorokhova E et al. Biological stoichiometry from genes to ecosystems. Ecology Letters, 2000, 3(6): 540-550. DOI:10.1111/j.1461-0248.2000.00185.x |
| [17] |
O'Brien PJ, Wehr JD. Periphyton biomass and ecological stoichiometry in streams within an urban to rural land-use gradient. Hydrobiologia, 2010, 657(1): 89-105. DOI:10.1007/s10750-009-9984-5 |
| [18] |
Cui JG, Shan BQ, Wang S. Ecological stoichiometric relationships of periphyton community elemental composition and variations of water quality in the Chaobai River. Environmental Science, 2012, 33(4): 1108-1113. [崔经国, 单保庆, 王帅. 潮白河周丛生物群落元素组成与水质变化的生态计量学关系研究. 环境科学, 2012, 33(4): 1108-1113.] |
| [19] |
Vis C, Hudon C, Cattaneo A et al. Periphyton as an indicator of water quality in the St Lawrence River (Québec, Canada). Environmental Pollution, 1998, 101(1): 13-24. DOI:10.1016/S0269-7491(98)00042-6 |
| [20] |
Vinebrooke RD, Graham MD. Periphyton assemblages as indicators of recovery in acidified Canadian Shield lakes. Canadian Journal of Fisheries and Aquatic Sciences, 1997, 54(7): 1557-1568. DOI:10.1139/f97-063 |
| [21] |
Gaiser E. Periphyton as an indicator of restoration in the Florida Everglades. Ecological Indicators, 2009, 9(6): S37-S45. DOI:10.1016/j.ecolind.2008.08.004 |
| [22] |
Godwin CM, Arthur MA, Carrick HJ. Periphyton nutrient status in a temperate stream with mixed land-uses: Implications for watershed nitrogen storage. Hydrobiologia, 2009, 623(1): 141-152. DOI:10.1007/s10750-008-9654-z |
| [23] |
Sterner RW, Elser JJ. Ecological stoichiometry: the biology of elements from molecules to the biosphere. Princeton: Princeton University Press, 2002.
|
| [24] |
Schiller DV, Martí E, Riera JL et al. Effects of nutrients and light on periphyton biomass and nitrogen uptake in Mediterranean streams with contrasting land uses. Freshwater Biology, 2007, 52(5): 891-906. DOI:10.1111/j.1365-2427.2007.01742.x |
| [25] |
Drake WM, Scott JT, Evans-White M et al. The effect of periphyton stoichiometry and light on biological phosphorus immobilization and release in streams. Limnology, 2012, 13(1): 97-106. DOI:10.1007/s10201-011-0359-z |
| [26] |
Hillebrand H, Kahlert M. Effect of grazing and nutrient supply on periphyton biomass and nutrient stoichiometry in habitats of different productivity. Limnology and Oceanography, 2001, 46(8): 1881-1898. DOI:10.4319/lo.2001.46.8.1881 |
| [27] |
Deng J, Zhang D, Zhang W et al. Carbon, nitrogen, and phosphorus stoichiometry and homeostasis characteristics of leaves, soil, and microbial biomass of Robinia pseudoacacia forests in the Loess Hilly Region of China. Acta Ecologica Sinica, 2019, 39(15): 5527-5535. [邓健, 张丹, 张伟等. 黄土丘陵区刺槐叶片-土壤-微生物碳氮磷化学计量学及其稳态性特征. 生态学报, 2019, 39(15): 5527-5535. DOI:10.5846/stxb201808281845] |
| [28] |
Yan DB, Xia PH, Song X et al. Community structure and functional diversity of epiphytic bacteria and planktonic bacteria on submerged macrophytes in Caohai Lake, southwest of China. Annals of Microbiology, 2019, 69(9): 933-944. DOI:10.1007/s13213-019-01485-4 |
| [29] |
Xia PH, Yan DB, Sun RG et al. Community composition and correlations between bacteria and algae within epiphytic biofilms on submerged macrophytes in a plateau lake, southwest China. Science of the Total Environment, 2020, 727: 138398. DOI:10.1016/j.scitotenv.2020.138398 |
| [30] |
Wu SL, Xia PH, Lin T et al. Contents and distribution characteristics of nitrogen forms in sediments of Guizhou Lake Caohai under different water level levels. J Lake Sci, 2019, 31(2): 407-415. [吴胜利, 夏品华, 林陶等. 贵州草海不同水位梯度下沉积物氮赋存形态及分布特征. 湖泊科学, 2019, 31(2): 407-415. DOI:10.18307/2019.0210] |
| [31] |
Tang XC, Lin T, Xia PH et al. Speciation distribution and risk assessment of Hg and As in sediment of Lake Caohai wetlands under different water level gradients, Guizhou Province. J Lake Sci, 2020, 32(1): 164-172. [汤向宸, 林陶, 夏品华. 贵州草海湿地不同水位梯度土壤碳、氮、磷含量及其生态化学计量比分布特征. 湖泊科学, 2020, 32(1): 164-172. DOI:10.18307/2020.0110] |
| [32] |
Yang J, Xia PH, Lin T et al. Distribution characteristics of iron speciation in sediments of Guizhou Caohai wetland under different water depths. Environmental Chemistry, 2019, 38(4): 105-113. [杨杰, 夏品华, 林陶等. 贵州草海湿地不同水深梯度下沉积物铁形态分布特征. 环境化学, 2019, 38(4): 105-113.] |
| [33] |
Yang Y, Xia PH, Lin T et al. Spatial distribution of soil carbon, nitrogen and phosphorus concentrations and their ecological stoichiometry along a water gradient in Caohai wetland, Guizhou Province. J Lake Sci, 2020, 32(1): 164-172. [杨羽, 夏品华, 林陶等. 贵州草海湿地不同水位梯度土壤碳、氮、磷含量及其生态化学计量比分布特征. 湖泊科学, 2020, 32(1): 164-172. DOI:10.18307/2020.0116] |
| [34] |
Persson J, Fink P, Goto A et al. To be or not to be what you eat: Regulation of stoichiometric homeostasis among autotrophs and heterotrophs. Oikos, 2010, 119(5): 741-751. DOI:10.1111/j.1600-0706.2009.18545.x |
| [35] |
Bradshaw C, Kautsky U, Kumblad L. Ecological stoichiometry and multi-element transfer in a coastal ecosystem. Ecosystems, 2012, 15(4): 591-603. DOI:10.1007/s10021-012-9531-5 |
| [36] |
Yoshihara Y, Sasaki T, Okuro T et al. Cross-spatial-scale patterns in the facilitative effect of shrubs and potential for restoration of desert steppe. Ecological Engineering, 2010, 36(12): 1719-1724. DOI:10.1016/j.ecoleng.2010.07.018 |
| [37] |
Wetzel RG, Ward AK, Stock M. Effects of natural dissolved organic matter on mucilaginous matrices of biofilm communities. Archiv Für Hydrobiologie, 1997, 139(3): 289-299. DOI:10.1127/archiv-hydrobiol/139/1997/289 |
| [38] |
Wilson SK, Bellwood DR, Choat JH et al. Detritus in the epilithic algal matrix and its use by coral reef fishes. Oceanography and Marine Biolog, 2003, 41: 279-309. |
| [39] |
Staats N, Stal LJ, Mur LR. Exopolysaccharide production by the epipelic diatom Cylindrotheca closterium: Effects of nutrient conditions. Journal of Experimental Marine Biology and Ecology, 2000, 249(1): 13-27. DOI:10.1016/S0022-0981(00)00166-0 |
| [40] |
Frost PC, Elser JJ, Turner MA. Effects of caddisfly grazers on the elemental composition of epilithon in a boreal lake. Journal of the North American Benthological Society, 2002, 21(1): 54-63. DOI:10.2307/1468299 |
| [41] |
Xu M, Bernards M, Hu ZQ. Algae-facilitated chemical phosphorus removal during high-density Chlorella emersonii cultivation in a membrane bioreactor. Bioresource Technology, 2014, 153: 383-387. DOI:10.1016/j.biortech.2013.12.026 |
| [42] |
Fan LY. Basic theory of ecological stoichiometry and its applications. Shanxi Forestry Science and Technology, 2016, 45(1): 37-39, 47. [樊兰英. 生态化学计量学的基本理论及应用领域. 山西林业科技, 2016, 45(1): 37-39, 47. DOI:10.3969/j.issn.1007-726X.2016.01.013] |
| [43] |
Hillebrand H, Sommer U. The nutrient stoichiometry of benthic microalgal growth: Redfield proportions are optimal. Limnology and Oceanography, 1999, 44(2): 440-446. DOI:10.4319/lo.1999.44.2.0440 |
| [44] |
Redfield AC. The biological control of chemical factors in the environment. American Scientist, 1958, 46(3): 205-221. |
| [45] |
Yu JL, Yang YK, Hu H et al. Investigation on current situation of corps' fertilization in Caohai Area of Weining. Hunan Agricultural Sciences, 2015(9): 51-54. [于健龙, 杨永奎, 胡辉等. 威宁草海种植区作物施肥现状调查. 湖南农业科学, 2015(9): 51-54.] |
| [46] |
Kahlert M. C: N: P ratios of freshwater benthic algae. Archive für Hydrobiologie Special Issues Advantage of Limnology, 1998, 51: 105-114. |
| [47] |
Gao XP, Wang Y, Sun BW et al. Nitrogen and phosphorus removal comparison between periphyton on artificial substrates and plant-periphyton complex in floating treatment wetlands. Environmental Science and Pollution Research, 2019, 26(21): 21161-21171. DOI:10.1007/s11356-019-05455-w |
| [48] |
Stelzer RS, Lamberti GA. Effects of N:P ratio and total nutrient concentration on stream periphyton community structure, biomass, and elemental composition. Limnology and Oceanography, 2001, 46(2): 356-367. DOI:10.4319/lo.2001.46.2.0356 |
 2021, Vol. 33

