(2: 科布多国立大学自然科学与技术研究所,科布多 84000)
(2: Institute of Natural Science and Technology, Khovd State University, Khovd 84000, Mongolia)
亚洲中部干旱半干旱地区作为全球主要的粉尘源区之一,每年向大气排放600 Mt沙尘[1]。其中蒙古的沙漠和戈壁地区春季沙尘暴产生的沙(粉)尘可输送到中国东部、北太平洋乃至全球[2-3]。因此研究蒙古地区风沙活动历史对于深刻理解北半球粉尘堆积及其环流背景具有重要意义[4]。但目前关于蒙古西部风沙或者粉尘活动历史的研究仅限于一些地貌证据[5-8],缺乏连续的沉积记录。另一方面,农业耕作、放牧等人类活动深刻地改变了地表景观,在不同程度上影响风沙活动的强度[9-10],而人类活动的影响程度难以评估[11],需要更多的研究。比较尘暴路径上不同人类活动强度地区风沙活动的历史,或许可以提供研究这一问题的线索。
干旱区湖泊沉积物的来源除了地表径流输入外,还有风力输入,沉积物粒径的变化既反映了湖泊水动力强弱[12-13],也包含了风沙活动的信息[10, 14-17]。如能从湖泊沉积物中准确提取出由风力搬运的组分,就可以用湖泊沉积物粒度恢复区域过去的风沙活动。目前已经得到运用的方法有Normal和Weibull分布函数拟合法[10, 16-19]、端元分析法[20-21]、粒级标准偏差法[2, 22-23]、因子分析法[24]等多种数学多组分划分方法,从多峰形态的频率分布曲线中分离出单一的粒度组分,为提取敏感组分进行沉积物来源及沉积过程分析奠定了基础;在实际研究中,可以针对不同地区湖泊的具体环境状况,选取合适的方法。本文利用蒙古国西北部阿尔泰地区Tolbo湖岩芯沉积物,采用对数正态分布函数[18]来拟合沉积物粒度频率曲线的各个组分,统计各组分的中值粒径频率[25],通过分析中值粒径频率曲线并结合粒级标准偏差曲线提取风成组分,重建全新世蒙古西北部风沙活动历史,试图理解研究区风沙活动历史的影响因素。
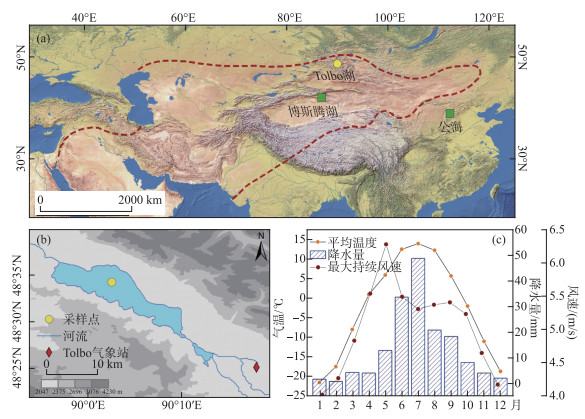
1 研究区概况Tolbo湖(48.57°N,90.04°E;2071.5 m a.s.l.,图 1)位于蒙古国西北部阿尔泰山以东,湖面面积约为78.75 km2(2013年),最大长度为21.1 km,最大宽度为6.6 km,湖泊呈西北东南向延伸,流域面积约为2000 km2 [26-27],湖盆两侧为3000 m以上的山脉,顶部均有冰川积雪[28]。Tolbo湖为开放湖泊,主要的补给河流自东南入湖,西北流出[26]。来自该湖东南侧的Tolbo站(48.42°N,90.30°E;2101 m a.s.l.;2010-2020年,GSOD数据集资料来源:GSOD数据集,https://www.ncei.noaa.gov/data/global-summary-of-the-day/。)气象资料显示区域年平均气温-2.4℃,年降水量159.3 mm,1月和7月的温差超过30℃;降水主要集中于夏季,但大风集中于春季(图 1c),特别是5月风速最大,月平均最大持续风速超过6 m/s(沙漠地区的起沙风速为6 m/s[29]),最大阵风风速达30~40 m/s。流域植被较为稀疏,整体为耐寒性的高山草原荒漠植被,嵩草、莎草群落分布广泛。流域基岩以花岗岩为主,湖泊周围特别是东北侧广泛分布洪积物和冲积物。

|
图 1 研究区概况:(a)Tolbo湖及本研究中对比的其他沙尘暴地质记录的地理位置(暗红色虚线是亚洲中部干旱区的大致范围(修改自文献[30]));(b)TB19-A岩芯的采样位置;(c)研究区现代气候状况(月均气温、降水及最大持续风速数据来自Tolbo气象站(2010-2020年)) Fig.1 The overview of the study area: (a) shows the location of Lake Tolbo and other sites of dust storm records compared in this study (The dark red dashed line encloses the approximate extent of the arid central Asia (modified from reference [30])); (b) shows the location of core TB19-A in Lake Tolbo; (c) is the modern climate regime of the study area (The monthly mean data (temperature, precipitation and maximum sustained wind velocity) are from Tolbo meteorological station (2010-2020)) |
2019年3月在Tolbo湖中心位置(11.5 m水深处;图 1)获取3根平行岩芯(TB19-A、TB19-B和TB19-C),通过平行钻孔岩芯扫描照片及元素数据对比,将TB19-A和TB19-B拼接为长度相同的(332 cm)两根岩芯。A孔岩芯按0.5 cm间隔进行分样,缺失层位用B孔对应层位样品补充(24个),共计588个样品。TB19-A、TB19-B两根岩芯共挑选20个全有机样品送至美国Beta实验室及兰州大学西部环境教育部重点实验室进行AMS14C测年。
沉积物样品粒度测试的前处理采用湖泊沉积物样品标准处理方法[31],测试仪器为英国Malvern公司生产的Mastersizer2000型激光粒度仪,在测量范围(0~2000 μm)内误差小于2 %。每个样品测试3次,取其平均值。粒度实验在兰州大学西部环境教育部重点实验室完成。
采用对数正态分布函数拟合与粒级标准偏差相结合的方法提取粒度敏感组分。对数正态分布函数拟合法是指设定的分布函数以原始数据中各粒级的粒径为自变量,以相应的百分含量为分布函数值,对沉积物样品粒度频率曲线进行拟合,结果以拟合残差最小为佳,得到组分的中值粒径与含量这两个重要的参数[18-19],进一步进行量化统计[25],从而获得搬运介质的信息。本文采用GrainAnalysis-2013程序对粒度频率曲线进行对数正态分布函数拟合[18]。粒级标准偏差方法是常用的粒度组分划分方法,能够明确地区分出沉积物不同粒级对湖泊环境变化的响应并提取敏感组分,反映粒级离散程度[22, 32-33]:通过实验测试获得沉积物各粒级的体积百分含量并计算其标准偏差,以对数粒级为横坐标、标准偏差为纵坐标作出粒级标准偏差曲线,根据曲线上峰谷与拐点判断环境敏感粒度组分,具体计算公式如下:
| $ S=\sqrt{\left[\sum\limits_{i=1}^n\left(x_i-\bar{x}\right)^2\right] /(n-1)} $ | (1) |
式中,S为标准偏差,n为样品数。
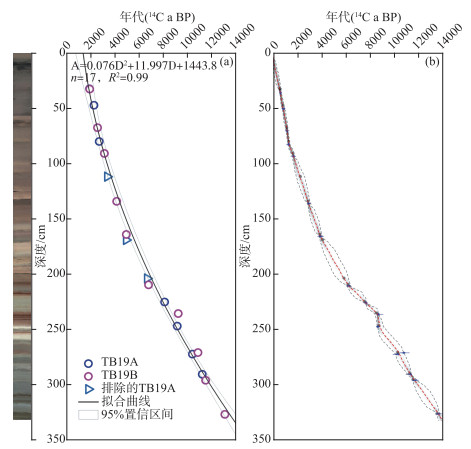
3 结果分析 3.1 建立年代框架AMS14C测年结果如表 1所示。干旱区湖泊通常陆生植物残体较少,而采用全有机质测年时年代结果中通常含有碳库效应,因此准确评估湖泊的碳库效应至关重要[34-35]。本研究利用截距法评估碳库效应,由于TB19-A、B平行岩芯深度已经校正和统一,先观察各孔年代深度分布特征,选取测年点分别回归。测年点选取的原则是两个孔分别回归后的方程系数尽可能相似(即满足平行孔沉积速率相似这一基本要求),此时即可将选取的测年结果合并,建立年代序列。这样TB19-A孔部分偏年轻层位的测年点(C2-87、A2-88、A3-6)不参与回归(表 1星号标出的年代,碳库效应小,但无法评估),因此建立年代时放弃使用。合并后经二次多项式回归(图 2a)的截距为1443.8 a,视为碳库效应,因本文测年实验室报道常规14C年代的精度为10 a,故碳库效应取值1440 a。将全有机测年材料所得的14C年龄扣除碳库后,在Bacon程序[36]中利用Intcal 20进行日历年校正[37],并使用贝叶斯模型获得各深度的年代。如图 2b所示,底部年龄为13.75 cal ka BP,样品的平均分辨率为23.5 a。
| 表 1 TB19孔AMS14C测年结果1) Tab. 1 AMS14C dating results of core TB19 |

|
图 2 TB19孔的AMS14C年代深度分布和年龄模型:(a)使用截距法进行碳库效应评估(碳库1440 14C年)(黑色实线为二次回归拟合曲线,灰色阴影为95 % 的置信区间范围);(b)Bacon输出的年代模型(红线为本研究中使用的年龄) Fig.2 The AMS14C age-depth distribution of TB19 core and the age model: (a) RE assessment using the interception method (RE≈1440 14C yrs) (The black line is the quadratic regression and the gray shading is the 95 % confidence range); (b) The age model output by Bacon (The red line is the age used in this research) |
岩芯沉积物粒度频率曲线能细致地反映不同粒径颗粒的含量变化,求解不同组分的粒径分布范围和相对含量可以追溯沉积物的物源和搬运方式[38-39],单一搬运介质稳定搬运时曲线呈正态分布的单峰,而由多种搬运介质以一定的方式稳定搬运形成的沉积物,其粒度总体上是单组分的自然累积,频率曲线表现为多峰光滑曲线[40]。图 3a显示了岩芯从顶部到底部的平均粒径变化,多数时段其变化幅度较小,波动于20~25 μm之间,根据变化情况将整个序列分为5个阶段,图 3b~f所示的五种曲线分别为对应阶段沉积物的典型粒度频率曲线及其函数拟合结果:岩芯顶部0~14 cm平均粒径较高,频率曲线为正偏态单峰型,中粗粉砂组分含量较高(图 3b);14~83 cm之间沉积物平均粒径较小,波动平缓,频率曲线上细粉砂是主导组分,中粗粉砂和砂组分含量较低(图 3c);83~187 cm平均粒径出现大幅波动,相应的频率曲线表现为多峰形态,中粗粉砂和砂组分的含量较上一阶段更高(图 3d);187~303 cm之间的平均粒径处于整根岩芯最低的阶段,变化较为稳定,仅个别时段出现波动,频率曲线呈现较窄的单峰形态,以黏土和细粉砂为主导组分(图 3e);底部303~332 cm平均粒径较高,频率曲线上的粗尾显示砂组分含量较高(图 3f)。整体来看稳定的湖相沉积物主要分为黏土和细粉砂两个组分,且以细粉砂组分为主(图 3e);具有多峰分布曲线的沉积物大致分为三组分型和四组分型(图 3b~d,f),其中的细粉砂仍是主要组分。

|
图 3 TB19-A孔岩芯粒度变化:(a)平均粒径变化及5个分段;(b~f)分段对应的典型粒度频率曲线及对数正态分布函数拟合结果 Fig.3 Grain size variations of core TB19-A: (a) The mean grain size change and five subsections; (b-f) Grain size-frequency distribution curves corresponding to the subsections and the fitting results of the log-normal distribution function |
在沉积环境和介质的搬运方式相对稳定时,沉积物各个组分的粒径范围也相对固定[25]。统计剖面各分离组分的中值粒径频率,得到中值粒径频率曲线(图 4a中的黑色折线),曲线中存在5个明显的粒级区间:< 3、3~15、15~84、84~510和>510 μm,分别对应黏土组分、细粉砂组分、中粗粉砂(含有部分细砂的混合组分)、细砂及中砂混合组分、粗砂组分,后两个组分含量较低(图 4c),将其合并统称为砂组分(>84 μm)。在粒径含量分布图(图 4c)中能看出不同成因组分的粒径和含量变化具有不同的范围,< 3、3~15以及84~510 μm粒径区间,中值粒径的分布较为集中,其中3~15 μm中值最为集中,含量几乎在50 % 以上,表明该组分对应的搬运和沉积过程较为稳定,沉积物以细粉砂组分为主;在15~84 μm粒径区间,中值粒径呈分散波动变化,频次较低,分布范围较广(图 4a),表明该组分所对应的沉积及搬运过程对环境变化的响应更为敏感。

|
图 4 TB19-A孔沉积物粒度分离结果与粒径含量分布:(a)中值粒径频率分布曲线;(b)粒级标准偏差曲线;(c)粒径含量分布图 Fig.4 Results of frequency, standard deviation, and content of separated components of sediments in core TB19-A: (a) is the median grain-frequency distribution curve; (b) is the grain size-standard deviation curve; (c) is the grain size-content distribution |
粒级标准偏差法同样可以获得不同粒径的环境敏感组分:通过描述沉积物样品在同一粒级的百分含量离散程度,来反映该粒级对应的沉积动力或沉积环境的变化[41-43]。粒级标准偏差分布曲线呈现多峰分布,表明沉积物受多种沉积因素控制,曲线上两个较高的标准偏差峰值出现在7和36 μm(图 4b),两个粒度组分的分界线大约在15 μm,以此粒径为界,两侧的组分为两种不同的动力所搬运。在大于150 μm的区间存在两个次峰,但两个峰较低,且该粒径组分在沉积物中占比较少,因此讨论时将其合并为一个组分。整体来看对数正态分布拟合法分离端元的结果(图 4a)与粒级标准偏差法(图 4b)确定的敏感组分基本一致,两种方法相互印证,分离结果可信。
4 讨论 4.1 Tolbo湖沉积物中风成组分的确定Tolbo湖形呈长条状,河流入湖口(东南一侧)距钻孔位置达14 km(图 1b),河流携带碎屑物质入湖后,因水动力减弱,其中的粗颗粒快速沉降,难以到达远离河口的钻孔位置。该湖两侧没有河流注入(图 1b),沿岸坡面径流受到干旱性气候(年降水量仅为159.3 mm)的限制,携带粗颗粒入湖的能力有限,钻孔(取样)位置距两侧岸边均超过3 km,坡面径流携带的粗颗粒也难以达到,深水区沉积物含量最高的为细粉砂(图 4c,中值粒径为3~15 μm,含量超过50 %),与粒级标准偏差指示的第一个动力对应,即流水搬运组分,也是多数湖泊深水区的典型沉积物粒度组成[17, 19]。中粗粉砂和部分细砂组分(中值粒径为15~84 μm)则对应于另一个搬运动力(图 4),这里主要考虑风力输入。研究表明中、粗粉砂颗粒能以短距离悬移方式运动,在沙尘暴事件中可上升至数百米的高度,被输送距离为几十到几百千米之间[44]。在中国北方,粗粉砂是沙尘暴的主导组分[17, 45],黄土高原上黄土的主导组分也是粗粉砂[46-47],青海湖粒径>25 μm的沉积物组分可以有效代表风沙活动[48]。Tolbo湖流域内戈壁荒漠是主要的地表景观,冬春季节时地表植被覆盖度低,且整个蒙古中西部都处于西伯利亚高压的控制之下[49-50],冷空气的下沉使得近地面盛行强劲的西北风,蒙古中西部以及南部成为整个东亚沙尘源区之一[51-52]。
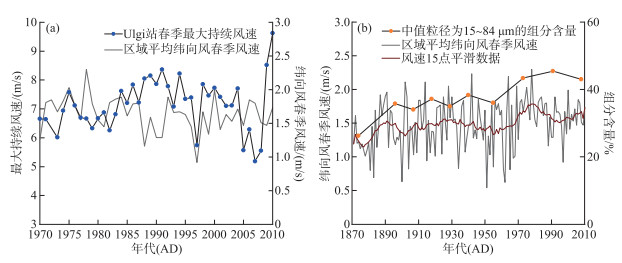
风速是影响风沙活动强度的关键因素[11, 47]。湖泊附近的Tolbo气象站风速观测资料持续时间短且不连续;位于采样点北部40 km的Ulgi站风速观测资料连续(1970-2010年),但由于钻孔顶部样品的平均分辨率较低(约15 a),观测时段内钻孔顶部仅有3个点的粒度数据,与风速的对比仍达不到统计要求。Tolbo湖流域盛行偏西风,春季风速最大(图 1c),因此本文选择持续时间较长的NOAA-CIRES 20世纪再分析月平均数据集,提取湖泊所在地区(48°~49°N,89°~91°E)范围内区域平均纬向风春季风速,与岩芯顶部样品的粒度资料进行对比。提取的区域平均纬向风春季风速与Ulgi站实际观测的春季最大持续风速变化趋势一致(图 5a),表明提取的风速可以代表当地风况。

|
图 5 研究区风况及其与湖泊沉积物中、粗粉砂组分的对比:(a)1970年以来春季最大持续风速与区域平均纬向风春季风速(NOAA-CIRES 20世纪月平均再分析数据)的对比;(b)区域平均纬向风春季风速与模型生成的中值粒径为15~84 μm的组分含量(年代已加20 a)的对比 Fig.5 Wind regime in the study region and its comparison with the fine to coarse silt fraction of sediments in Lake Tolbo: (a) shows the comparison between the observed maximum sustained wind velocity since the 1970s and the regional average zonal wind velocity in spring (monthly mean re-analyzed data from NOAA-CIRES 20); (b) shows the comparison between the regional average zonal wind velocity in spring and the content of components with the median grain size of 15-84 μm generated by the model |
将模型生成的中值粒径为15~84 μm的组分含量变化与纬向风春季风速进行对比,发现二者整体的变化趋势一致,但15~84 μm组分含量整体滞后风速20 a左右,可能是由于岩芯顶部缺少测年及碳库评估的误差使得年代存在一定的误差。若将岩芯上部样品年代整体加上20 a,则两者的变化趋势十分相似(图 5b)。表明碳库效应评估可能偏小20 a,也证实了15~84 μm组分主要来源于春季强风导致的沙尘暴活动。因此我们将中值粒径为15~84 μm的组分归因于区域尘暴成因的沙尘输入,这与中国季风区边缘湖泊公海的尘暴组分(众数粒径为19~78 μm[10])的粒径范围几乎一致。
岩芯中中值粒径>84 μm的砂组分含量较小(图 4c),有些样品中则不含这一组分。湖泊中心位置沉积物中的砂组分主要是冬季结冰后,近源沙尘以蠕移或跃移方式到达冰面并被(冻融作用)固定,在冰融化后沉降入湖的[10, 14-15]。例如岩芯107 cm附近平均粒径处于峰值阶段(图 3a),沉积物中甚至出现了粒径>1000 μm的粗砂颗粒,即属于这种情况。Tolbo湖所在的巴彦乌列盖地区春季的最大阵风风速可达到30~40 m/s,风沙活动频繁。邻近地区(相距90 km)的冰碛阶地及洪泛平原上风成沉积物的粒径分布显示,峰值基本出现在细砂(63~200 μm)和中砂(200~630 μm)部分[8],与Tolbo湖沉积物指示局地风沙活动的组分(中值粒径>84 μm)粒径分布范围较为一致。
综上所述,本文使用中值粒径为15~84 μm的组分含量反映大范围可被远距离(超过数十千米[44])搬运的区域(远源)尘暴活动(含量高指示尘暴强);中值粒径>84 μm的组分含量则反映湖泊周边或流域范围内(近源)的局地或湖区风沙活动。
4.2 蒙古西北部全新世风沙活动历史及可能机制图 6a和b分别代表末次冰消期晚期以来局地风沙活动和区域尘暴活动的情况。12 cal ka BP之前局地风沙活动较强,大范围远源的尘暴较弱,这一阶段与北半球末次冰消期的新仙女木(Younger Dryas, 简称YD)寒冷事件(12.8-11.6 cal ka BP)在时间上有较多的重合,因此推断YD冷事件期间,流域内有较强的局地风沙活动。全新世(11.6 cal ka BP)以来,局地的风沙活动和区域尘暴活动变化趋势相似(图 6a和b),表明二者同步发生。

|
图 6 Tolbo湖风沙活动重建及区域对比:(a)Tolbo湖局地风沙活动(>84 μm组分);(b)蒙古西北部区域尘暴活动(15~84 μm组分)(彩色圆点为模型中生成的组分含量,对应的曲线为5点平滑结果);(c)公海湖泊尘暴活动[10](橙点代表标准化后的原始数据,酒红色曲线代表 10点平滑结果);(d)博斯腾湖尘暴活动[53](橙色条带代表干湖或极低水位状态);(e)西伯利亚高压记录[60](灰色实线为原始数据50 a内插结果,彩色实线为500 a点平滑结果);(f)45°N 1月份太阳辐射的变化[61] (灰色阴影标出的是西伯利亚高压增强所对应的风沙活动增强的阶段) Fig.6 Eolian activities reconstructed by coarse fractions of sediments from Lake Tolbo and their comparison with regional records: (a) Local aeolian sand activities (fraction >84 μm) from Lake Tolbo; (b) Regional dust storms (fraction 15-84 μm) in NW Mongolia (The colored dots represent the component contents generated in the model and the corresponding curves represent 5-point smoothing results); (c) Dust storms in Lake Gonghai[10] (Orange dots represent standardized original data and the wine curve represents 10-point smoothing result); (d) Dust storms in Lake Bosten[53] (The yellow bar indicates an interval of dry lake conditions or a very low lake level); (e) The Siberian High record[60] (The solid gray line is the interpolation result of original data within 50 years, and the solid color line is the point smoothing result of 500 years); (f) Variations of solar radiation in January at 45°N[61] (Gray shadows indicate the periods of strengthened eolian activities corresponding to the strengthening of the Siberian High) |
蒙古西北部全新世风沙活动可以分为3个阶段(图 6a,b):1)早中全新世风沙活动整体较弱,其中早全新世9.7-8.6 cal ka BP湖区风沙活动和区域尘暴即已出现,7-6 cal ka BP为尘暴较强时段;2)5 cal ka BP之后开始局地风沙活动与区域尘暴活动增加(强),直到0.7 cal ka BP两者均维持在较高水平;3)0.3 cal ka BP以来区域尘暴活动强烈,为整个序列最高(强)的时段。蒙古西北部的风沙活动研究资料显示,Tsengel(臣格勒)和Turgen(图尔根,蒙古阿尔泰山)山,在中全新世广泛分布古土壤层,指示该阶段风蚀弱,风成堆积速率低;晚全新世3 ka以来,风成堆积速率急剧增加[8]。Uvs湖沉积记录显示中全新世植被发育,5 ka之后风沙活动导致沙丘开始移动[7]。因此Tolbo湖风沙活动记录与已有的记录可以对应。
将蒙古西北部区域尘暴历史(图 6b)与中国北方尘暴记录(公海沉积物众数粒径为19~78 μm的组分含量[10],图 6c)及博斯腾湖沉积物尘暴记录(众数粒径为30~233 μm的组分含量[53],图 6d)进行对比,结果显示蒙古西北部与我国华北的强尘暴时期具有很好的一致性,在7-6 cal ka BP和3-1 cal ka BP期间我国新疆博斯腾湖、蒙古西北部和我国华北地区3地均为尘暴较强的阶段。大范围同时发生尘暴,则是区域受同一大气环流系统影响的体现,华北地区公海尘暴记录与新疆、蒙古西北地区全新世风沙活动记录类似,反映了亚洲粉尘传输路径上的风沙活动具有同步性,对2021年3月15日中国北方特大沙尘暴粉尘传输过程的研究[51]证实,蒙古高压中心(蒙古北部)外围包括蒙古中西部(粉尘源区)以及我国新疆、内蒙和华北地区同期经历了该次尘暴。
春季冷暖气流交汇时,低纬度热量向高纬的传播会破坏西伯利亚高压的稳定性。大气环流不稳定与强径向温度梯度是冷锋产生的必要条件[3],强冷锋过境时较高的阵风风速易产生沙尘暴[54]。一般认为在百年尺度上西伯利亚高压增强时,沙尘暴频发[33, 55-56],但本文对比结果显示,这种对应关系似乎是:蒙古高压增强的时期(如9.7-8.6、7-6、5-3和1.5-0.5 cal ka BP,图 6e)尘暴活动在蒙古西北和我国华北地区的确增强(图 6a~c),但蒙古高压极大值的时期(如10.8、8.5、5.5、3.0和0.5 cal ka BP,图 6e)并不是大范围的尘暴活动极强时期。在关于东亚的粉尘研究中一般将沙尘的产生与运输看作是冬季环流的代表[16, 56-57]。然而,西伯利亚高压在冬季最强盛,蒙古及中国北方的沙尘暴发生频率最高的时间却是在春季[45, 54],两者之间存在时间差。虽然平均地面风速在冬季最大,但是春季强劲的阵风风速更高,对尘暴的影响更大[3],Tolbo湖流域的气象数据显示春季(5月)的时候风速最大(图 1c)。在高压强的时候(冬季),受单一的下沉干冷空气控制,大气气团稳定,稳定的天气系统下无尘暴发生;但在高压减弱时(春季),大气垂直稳定性降低,高层空气易与近地面相互作用而产生气旋。春季蒙古阿尔泰背风面频繁发展气旋系统[3],沙尘暴频发。因此在年际尺度上沙尘暴频率和西伯利亚高压的强度呈负相关关系[58],这或许也是本文结果中极强的区域尘暴并不对应于西伯利亚高压极大值的原因。
北半球冬季太阳辐射在全新世呈逐渐增加的趋势(图 6f),春季地表热量增加、降水偏少,且处于土壤逐渐解冻时期,干燥裸露的地表为沙尘暴的发生提供了丰富的沙源[59],同时大陆中低纬与高纬间温度梯度增大,产生较强的冷锋,具备尘暴发生的条件[3]。因此冬季太阳辐射增加可能也是蒙古西部及中国北方晚全新世风沙活动增强(图 6a~d)的原因之一。
Tolbo湖流域过去300 a来的风沙活动强度达到全新世最强(图 6b),可能是叠加了人类活动的重要影响,使其超出了之前全新世期间的变化范围。由于缺少研究区详细的人类活动记录,尚不足以讨论现代及更长时间尺度上人类活动对该区粉尘的具体影响。但可以推论的是,晚全新世以来蒙古西部和我国华北地区的风沙活动同步增强(图 6b,c),即在亚洲粉尘传输路径上,两地尘暴同步增强,说明环流因素是共同的主导因素。气团运移下方地表植被覆盖(可蚀性)是当地尘暴强度的关键[51],因此要评价人类活动对尘暴的影响,需要使用能指示植被覆盖的指标,人类活动是否主导或驱动了我国华北地区过去2 ka的尘暴[9-10],期待更多的研究和记录来验证。
5 结论通过分析蒙古国西北部高山湖泊Tolbo湖沉积物的粒度特征,采用对数正态分布函数拟合并结合粒级标准偏差曲线提取出沉积物中的风成组分,重建了全新世以来蒙古西北部风沙活动的历史,与邻近地区及中国北方尘暴记录进行对比,简要探讨了影响该区域风沙活动历史的可能机制,得出结论如下:
1) Tolbo湖沉积物中值粒径为15~84 μm的组分含量可以反映蒙古西北部区域尘暴活动的变化,中值粒径>84 μm的组分含量则反映局地风沙活动,两组分含量的变化趋势具有一致性,即湖泊局地风沙活动与较大范围的尘暴活动同步发生。
2) 蒙古西北部地区末次冰消期晚期(13.75-11.6 cal ka BP),Tolbo湖流域内有较强的局地风沙活动可能与YD寒冷事件有关;早中全新世风沙活动总体较弱,但9.7-8.6和7-6 cal ka BP时段多尘暴活动;5 cal ka BP之后局地风沙和区域尘暴活动强度显著增加,直至0.7 cal ka BP两者均维持在较高水平;0.3 cal ka BP以来区域尘暴活动再次增强,为全新世以来最强的时段。
3) 蒙古西北部区域尘暴历史与中国北方公海、博斯腾湖记录的尘暴历史变化趋势一致,反映了与西伯利亚高压有关的大气环流对于干旱区大范围风沙活动的影响;晚全新世风沙活动的增强可能受到冬季太阳辐射增加的影响;过去300 a来的强风沙活动可能叠加了人类活动的影响。
由于未能获得研究区现代尘暴样品和冰面粉尘样品,本文结果缺少现代风沙或尘暴样品粒度数据的支持,需要在今后的研究中改进。
致谢: 兰州大学博士研究生张军、向丽雄参加了湖泊岩芯钻探工作,在此一并致谢!
| [1] |
Shao YP, Wyrwoll KH, Chappell A et al. Dust cycle: An emerging core theme in Earth system science. Aeolian Research, 2011, 2(4): 181-204. DOI:10.1016/j.aeolia.2011.02.001 |
| [2] |
Uno I, Eguchi K, Yumimoto K et al. Asian dust transported one full circuit around the globe. Nature Geoscience, 2009, 2(8): 557-560. DOI:10.1038/ngeo583 |
| [3] |
Roe G. On the interpretation of Chinese loess as a paleoclimate indicator. Quaternary Research, 2009, 71(2): 150-161. DOI:10.1016/j.yqres.2008.09.004 |
| [4] |
Maher BA, Prospero JM, Mackie D et al. Global connections between aeolian dust, climate and ocean biogeochemistry at the present day and at the last glacial maximum. Earth-Science Reviews, 2010, 99(1/2): 61-97. DOI:10.1016/j.earscirev.2009.12.001 |
| [5] |
Lehmkuhl F, Hilgers A, Fries S et al. Holocene geomorphological processes and soil development as indicator for environmental change around Karakorum, Upper Orkhon Valley (Central Mongolia). CATENA, 2011, 87(1): 31-44. DOI:10.1016/j.catena.2011.05.005 |
| [6] |
Lehmkuhl F, Hülle D, Knippertz M. Holocene geomorphic processes and landscape evolution in the lower reaches of the Orkhon River (northern Mongolia). CATENA, 2012, 98: 17-28. DOI:10.1016/j.catena.2012.06.003 |
| [7] |
Grunert J, Lehmkuhl F, Walther M. Paleoclimatic evolution of the Uvs Nuur Basin and adjacent areas (Western Mongolia). Quaternary International, 2000, 65/66: 171-192. DOI:10.1016/S1040-6182(99)00043-9 |
| [8] |
Klinge M, Lehmkuhl F, Schulte P et al. Implications of (reworked) aeolian sediments and paleosols for Holocene environmental change in Western Mongolia. Geomorphology, 2017, 292: 59-71. DOI:10.1016/j.geomorph.2017.04.027 |
| [9] |
Chen FH, Chen SQ, Zhang X et al. Asian dust-storm activity dominated by Chinese dynasty changes since 2000 BP. Nature Communications, 2020, 11: 992. DOI:10.1038/s41467-020-14765-4 |
| [10] |
Chen SQ, Liu JB, Wang X et al. Holocene dust storm variations over Northern China: Transition from a natural forcing to an anthropogenic forcing. Science Bulletin, 2021, 66(24): 2516-2527. DOI:10.1016/j.scib.2021.08.008 |
| [11] |
Zhang S, Xu H, Lan JH et al. Dust storms in Northern China during the last 500 years. Science China Earth Sciences, 2021, 64(5): 813-824. DOI:10.1007/s11430-020-9730-2 |
| [12] |
Huang XZ, Chen FH, Xiao S et al. Primary study on the environmental significances of grain-size changes of the Lake Bosten sediments. J Lake Sci, 2008, 20(3): 291-297. [黄小忠, 陈发虎, 肖舜等. 新疆博斯腾湖沉积物粒度的古环境意义初探. 湖泊科学, 2008, 20(3): 291-297. DOI:10.18307/2008.0305] |
| [13] |
Sun QL, Zhou J, Xiao JL. Grain-size characteristics of Lake Daihai sediments and its paleaoenvironment significance. Marine Geology & Quaternary Geology, 2001, 21(1): 93-95. [孙千里, 周杰, 肖举乐. 岱海沉积物粒度特征及其古环境意义. 海洋地质与第四纪地质, 2001, 21(1): 93-95.] |
| [14] |
Qiang MR, Chen FH, Zhang JW et al. Grain size in sediments from Lake Sugan: A possible linkage to dust storm events at the northern margin of the Qinghai-Tibetan Plateau. Environmental Geology, 2007, 51(7): 1229-1238. DOI:10.1007/s00254-006-0416-9 |
| [15] |
Qiang MR, Liu YY, Jin YX et al. Holocene record of eolian activity from Genggahai Lake, northeastern Qinghai-Tibetan Plateau, China. Geophysical Research Letters, 2014, 41(2): 589-595. DOI:10.1002/2013gl058806 |
| [16] |
Sun YB, Tada R, Chen J et al. Tracing the provenance of fine-grained dust deposited on the central Chinese Loess Plateau. Geophysical Research Letters, 2008, 35: L01804. DOI:10.1029/2007gl031672 |
| [17] |
Sun DH, Bloemendal J, Rea DK et al. Grain-size distribution function of polymodal sediments in hydraulic and aeolian environments, and numerical partitioning of the sedimentary components. Sedimentary Geology, 2002, 152(3/4): 263-277. DOI:10.1016/S0037-0738(02)00082-9 |
| [18] |
Qin XG. Loess record of the aerodynamic environment in the east Asia monsoon area since 60, 000 years before present. Journal of Geophysical Research Atmospheres, 2005, 110(B1): B01204. DOI:10.1029/2004jb003131 |
| [19] |
Yin ZQ, Qin XG, Wu JS et al. Multimodal grain-size distribution characteristics and formation mechanism of lake sediments. Quaternary Sciences, 2008, 28(2): 345-353. [殷志强, 秦小光, 吴金水等. 湖泊沉积物粒度多组分特征及其成因机制研究. 第四纪研究, 2008, 28(2): 345-353.] |
| [20] |
Zhang XN, Zhou AF, Huang ZD et al. Moisture evolution in North Xinjiang (northwest China) during the last 8000 years linked to the westerlies' winter half-year precipitation. Quaternary Research, 2021, 100: 122-134. DOI:10.1017/qua.2020.94 |
| [21] |
Fan JW, Jiang HC, Shi W et al. A 450-year warming and wetting climate in southern Altay inferred from a Yileimu Lake sediment core. Quaternary International, 2021, 592: 37-50. DOI:10.1016/j.quaint.2021.04.035 |
| [22] |
Zhou JC, Wu JL, Zeng HA. Environmental characteristics inferred from sediment sensitive grain-size component records in Kanas Lake of Xinjiang. Journal of Earth Sciences and Environment, 2016, 38(6): 859-868. [周建超, 吴敬禄, 曾海鳌. 新疆喀纳斯湖沉积物粒度组分所揭示的环境特征. 地球科学与环境学报, 2016, 38(6): 859-868. DOI:10.3969/j.issn.1672-6561.2016.06.011] |
| [23] |
Lan JH, Xu H, Sheng EG et al. Climate changes reconstructed from a glacial lake in High Central Asia over the past two millennia. Quaternary International, 2018, 487: 43-53. DOI:10.1016/j.quaint.2017.10.035 |
| [24] |
Ma L, Wu JL, Jilili A. Environmental changes inferred from environmentally sensitive grain-size component records in Chaiwopu Lake, Xinjiang. Acta Sedimentologica Sinica, 2012, 30(5): 945-954. [马龙, 吴敬禄, 吉力力·阿不都外力. 新疆柴窝堡湖沉积物中环境敏感粒度组分揭示的环境信息. 沉积学报, 2012, 30(5): 945-954.] |
| [25] |
Guo F, Sun DH, Wang F et al. Grain-size distribution pattern of the depositional sequence in central Badain Jaran Desert and its genetic interpretation. Marine Geology & Quaternary Geology, 2014, 34(1): 165-173. [郭峰, 孙东怀, 王飞等. 巴丹吉林沙漠地层序列的粒度分布及其组分成因分析. 海洋地质与第四纪地质, 2014, 34(1): 165-173.] |
| [26] |
Mitamura O, Khadbaatar D, Ishida N. Comparative investigation of chemical and biological characteristics in waters and trophic state of Mongolian lakes. Limnology, 2010, 11(1): 17-30. DOI:10.1007/s10201-009-0280-x |
| [27] |
Zhang GQ, Yao TD, Piao SL et al. Extensive and drastically different alpine lake changes on Asia's high plateaus during the past four decades. Geophysical Research Letters, 2017, 44(1): 252-260. DOI:10.1002/2016gl072033 |
| [28] |
Kamp U, Pan CG. Inventory of glaciers in Mongolia, derived fromlandsat imagery from 1989 to 2011. Geografiska Annaler: Series A, Physical Geography, 2015, 97(4): 653-669. DOI:10.1111/geoa.12105 |
| [29] |
Chen WN, Dong ZB, Yang ZT et al. Threshold velocities of sand-driving wind in the Taklimakan Desert. Acta Geographica Sinica, 1995, 50(4): 361-367. [陈渭南, 董治宝, 杨佐涛等. 塔克拉玛干沙漠的起沙风速. 地理学报, 1995, 50(4): 360-367.] |
| [30] |
Feng S, Fu Q. Expansion of global drylands under a warming climate. Atmospheric Chemistry and Physics, 2013, 13(19): 10081-10094. DOI:10.5194/acp-13-10081-2013 |
| [31] |
Peng YJ, Xiao JL, Nakamura T et al. Holocene East Asian monsoonal precipitation pattern revealed by grain-size distribution of core sediments of Daihai Lake in Inner Mongolia of north-central China. Earth and Planetary Science Letters, 2005, 233(3/4): 467-479. DOI:10.1016/j.epsl.2005.02.022 |
| [32] |
Wang JZ, Wu JL, Zeng HA. Grain-size characteristics and its environmental significance of Lake Chenpuhai sediments in Hetao plain, Inner Mongolia. Marine Geology & Quaternary Geology, 2014, 34(5): 137-144. [汪敬忠, 吴敬禄, 曾海鳌. 内蒙古河套地区陈普海子湖泊沉积物粒度特征及其环境意义. 海洋地质与第四纪地质, 2014, 34(5): 137-144.] |
| [33] |
Chen FH, Qiang MR, Zhou AF et al. A 2000-year dust storm record from Lake Sugan in the dust source area of arid China. Journal of Geophysical Research: Atmospheres, 2013, 118(5): 2149-2160. DOI:10.1002/jgrd.50140 |
| [34] |
Zhang JW, Ma XY, Qiang MR et al. Developing inorganic carbon-based radiocarbon chronologies for Holocene Lake sediments in arid NW China. Quaternary Science Reviews, 2016, 144: 66-82. DOI:10.1016/j.quascirev.2016.05.034 |
| [35] |
Hou JZ, D'Andrea WJ, Liu ZH. The influence of 14C reservoir age on interpretation of paleolimnological records from the Tibetan Plateau. Quaternary Science Reviews, 2012, 48: 67-79. DOI:10.1016/j.quascirev.2012.06.008 |
| [36] |
Blaauw M, Christen JA. Flexible paleoclimate age-depth models using an autoregressive gamma process. Bayesian Analysis, 2011, 6(3): 457-474. DOI:10.1214/ba/1339616472 |
| [37] |
Reimer PJ, Austin WEN, Bard E et al. The IntCal20 Northern Hemisphere radiocarbon age calibration curve (0-55 cal kBP). Radiocarbon, 2020, 62(4): 725-757. DOI:10.1017/rdc.2020.41 |
| [38] |
An CB, Zhao JJ, Tao SC et al. Dust variation recorded by lacustrine sediments from arid Central Asia since~15 cal ka BP and its implication for atmospheric circulation. Quaternary Research, 2011, 75(3): 566-573. DOI:10.1016/j.yqres.2010.12.015 |
| [39] |
Machalett B, Oches EA, Frechen M et al. Aeolian dust dynamics in central Asia during the Pleistocene: Driven by the long-term migration, seasonality, and permanency of the Asiatic polar front. Geochemistry, Geophysics, Geosystems, 2008, 9(8). DOI:10.1029/2007gc001938 |
| [40] |
Jiang QF, Liu XQ, Shen J. Grain-size characteristics of Wulugu Lake sediments and its palaeoclimate and palaeoenvironment implication. Acta Sedimentologica Sinica, 2006, 24(6): 877-882. [蒋庆丰, 刘兴起, 沈吉. 乌伦古湖沉积物粒度特征及其古气候环境意义. 沉积学报, 2006, 24(6): 877-882.] |
| [41] |
Xu SJ, Pan BT, Li Q et al. Environmental significance and characteristics of grain size of the loess in Longxi Basin during the last glacial period. Acta Sedimentologica Sinica, 2005, 23(4): 702-708. [徐树建, 潘保田, 李琼等. 陇西盆地末次冰期黄土粒度特征及其环境意义. 沉积学报, 2005, 23(4): 702-708.] |
| [42] |
Xiang R, Yang ZS, Saito Y et al. The east Asian winter monsoon changes recorded by the environmental sensitive particle composition in the southeast mud region of Jeju island near 2300 a. Science in China: Series D: Earth Sciences, 2006, 36(7): 654-662. [向荣, 杨作升, Saito Y等. 济州岛西南泥质区近2300 a来环境敏感粒度组分记录的东亚冬季风变化. 中国科学D辑: 地球科学, 2006, 36(7): 654-662.] |
| [43] |
Wang JJ, Li CY, Zhao SN et al. The extraction of the environmentally sensitive grain size composition in the sediment of Hulun Lake. Journal of Water Resources and Water Engineering, 2017, 28(2): 105-109. [王静洁, 李畅游, 赵胜男等. 呼伦湖沉积物中环境敏感粒度组分提取. 水资源与水工程学报, 2017, 28(2): 105-109.] |
| [44] |
Tsoar H, Pye K. Dust transport and the question of desert loess formation. Sedimentology, 1987, 34(1): 139-153. DOI:10.1111/j.1365-3091.1987.tb00566.x |
| [45] |
Sun DH, Chen FH, Bloemendal J et al. Seasonal variability of modern dust over the Loess Plateau of China. Journal of Geophysical Research: Atmospheres, 2003, 108(D21). DOI:10.1029/2003jd003382 |
| [46] |
Liu DS, An ZS, Yuan BY. Eolian process and dust mantle(loess) in China. Quaternary Science, 1985(1): 113-125. [刘东生, 安芷生, 袁宝印. 中国的黄土与风尘堆积. 第四纪研究, 1985(1): 113-125.] |
| [47] |
Sun DH, Bloemendal J, Rea DK et al. Bimodal grain-size distribution of Chinese loess, and its palaeoclimatic implications. CATENA, 2004, 55(3): 325-340. DOI:10.1016/S0341-8162(03)00109-7 |
| [48] |
An ZS, Colman SM, Zhou WJ et al. Interplay between the Westerlies and Asian monsoon recorded in Lake Qinghai sediments since 32 ka. Scientific Reports, 2012, 2: 619. DOI:10.1038/srep00619 |
| [49] |
Böhner J. General climatic controls and topoclimatic variations in Central and High Asia. Boreas, 2006, 35(2): 279-295. DOI:10.1080/03009480500456073 |
| [50] |
Sorrel P, Oberhänsli H, Boroffka N et al. Control of wind strength and frequency in the Aral Sea Basin during the late Holocene. Quaternary Research, 2007, 67(3): 371-382. DOI:10.1016/j.yqres.2006.12.003 |
| [51] |
Liang P, Chen B, Yang XP et al. Revealing the dust transport processes of the 2021 mega dust storm event in Northern China. Science Bulletin, 2022, 67(1): 21-24. DOI:10.1016/j.scib.2021.08.014 |
| [52] |
Qiu XF, Zeng Y, Miao QL. Temporal-spatial distribution as well as tracks and source areas of sand-dust storms in China. Acta Geographica Sinica, 2001, 56(3): 316-322. [邱新法, 曾燕, 缪启龙. 我国沙尘暴的时空分布规律及其源地和移动路径. 地理学报, 2001, 56(3): 316-322.] |
| [53] |
Xie HC, Liang J, Vachula RS et al. Changes in the hydrodynamic intensity of Bosten Lake and its impact on early human settlement in the northeastern Tarim Basin, Arid Central Asia. Palaeogeography, Palaeoclimatology, Palaeoecology, 2021, 576: 110499. DOI:10.1016/j.palaeo.2021.110499 |
| [54] |
Zhou ZJ, Zhang GC. Typical severe dust storms in northern China during 1954-2002. Chinese Science Bulletin, 2003, 48(11): 1224-1228. [周自江, 章国材. 中国北方的典型强沙尘暴事件(1954-2002年). 科学通报, 2003, 48(11): 1224-1228.] |
| [55] |
Zhou GP, Huang XZ, Wang ZL et al. Eolian activity history reconstructed by Bosten Lake grain size data over the past 2000 years. Journal of Desert Research, 2019, 39(2): 86-95. [周刚平, 黄小忠, 王宗礼等. 基于粒度数据重建的近2000a新疆博斯腾湖区域风沙活动. 中国沙漠, 2019, 39(2): 86-95.] |
| [56] |
Xu B, Wang L, Gu ZY et al. Decoupling of climatic drying and Asian dust export during the Holocene. Journal of Geophysical Research: Atmospheres, 2018, 123(2): 915-928. DOI:10.1002/2017jd027483 |
| [57] |
An ZS, Kukla G, Porter SC et al. Late quaternary dust flow on the Chinese Loess Plateau. CATENA, 1991, 18(2): 125-132. DOI:10.1016/0341-8162(91)90012-M |
| [58] |
Ding RQ. Decadal change of the spring dust storm in northwest China and the associated atmospheric circulation. Geophysical Research Letters, 2005, 32(2): L02808. DOI:10.1029/2004gl021561 |
| [59] |
Duan BL, Liu XW, Guo RX et al. Cause analysis on severe dust storm in northern China on 15 March 2021. Journal of Arid Meteorology, 2021, 39(4): 541-553. [段伯隆, 刘新伟, 郭润霞等. "3·15"北方强沙尘暴天气成因分析. 干旱气象, 2021, 39(4): 541-553.] |
| [60] |
Mayewski PA, Rohling EE, Stager JC et al. Holocene climate variability. Quaternary Research, 2004, 62(3): 243-255. DOI:10.1016/j.yqres.2004.07.001 |
| [61] |
Laskar J, Robutel P, Joutel F et al. A long-term numerical solution for the insolation quantities of the Earth. Astronomy & Astrophysics, 2004, 428(1): 261-285. DOI:10.1051/0004-6361:20041335 |
 2023, Vol. 35

