(2: 南京信息工程大学江苏省农业气象重点实验室, 南京 210044)
(3: 南京市江宁区气象局, 南京 211199)
(2: Jiangsu Key Laboratory of Agricultural Meteorology, Nanjing University of Information Science & Technology, Nanjing 210044, P.R. China)
(3: Meteorological Bureau of Nanjing Jiangning District, Nanjing 211199, P.R. China)
湖泊是气候变化的指示器[1],水温升高是湖泊对气候变暖最直接的响应[2-3]。原位观测和遥感反演显示全球湖泊水温以0.34℃/(10 a)的速率升高[4-5],增暖趋势在未来高排放情景下愈加显著[6-7]。湖泊升温改变了湖泊的物理、化学、生物和生态过程。首先,作为大气模型的下边界,湖面温度升高改变了湖泊与大气之间的温度和湿度梯度,影响湖气界面的感热和潜热交换[8]。作为湖体温度垂直分布的初始值[9],湖面温度升高改变了水温垂直分层,影响湖体内热量和动量的垂直交换[10-11]。其次,湖泊升温使得深水湖泊的热力层结增强、垂直混合减弱,深水区溶解氧下降和底栖物种代谢减速[12-13]。而且,湖泊升温促进CH4排放和蓝藻异常增殖。观测显示水温高时湖气界面CH4排放量是水温低时的5.2倍[14]。据估计,到21世纪末,北方湖泊CH4排放量最大增幅可达54%[15],蓝藻暴发频率将增加20%[16]。为评估气候变暖对湖泊物理、化学、生物和生态过程的影响,需要在不同时间尺度上观测湖泊温度。
目前观测湖泊温度的方法主要有原位观测和红外遥感反演,但两者获取的水温因测量深度不同存在本质差异。原位观测获取的是表层水温[5],即利用温度传感器在湖水表层一定深度处(约0.5 m)直接测量水温。而红外遥感反演获取的是湖泊表面温度[17],即基于卫星传感器的热红外数据通过辐射传输方程等算法反演得到湖泊与大气界面薄层(< 500 μm)的温度。原位观测持续时间短、覆盖范围小[18-19],红外遥感反演能拓展湖面温度研究的时空尺度[20]。常用于反演湖面温度的卫星传感器有MODIS的Terra和Aqua、NOAA发布的AVHRR传感器、欧洲空间局设计的ATSR系列传感器、Landsat8的TIR传感器、Landsat7的ETM+传感器和Aqua卫星上的ASTER传感器[21],中国发射的风云(FY)系列卫星MERSI传感器和VIRR传感器[22]、环境资源卫星(HJ)的IRS传感器[23]也常被用于反演湖面温度。上述卫星传感器的参数见表 1。
红外遥感反演得到的湖面温度与原位观测得到的表层水温在物理过程、数值大小和影响因素上存在差异[24-25]。在湖气界面薄层内,湖面温度主要受分子热传导控制[26],而表层水温主要受水体湍流和太阳辐射共同控制[18]。由于物理过程不同,表面温度与表层水温的数值存在差异[27],称为“皮肤效应”(skin effect)。“皮肤效应”的大小通常以表面温度与表层水温的差值表示,根据数值正负,分为暖“皮肤效应”(表面温度高于表层水温)和冷“皮肤效应”(表面温度低于表层水温)[28-29]。“皮肤效应”主要受湖水吸收的太阳辐射、湖面与大气之间的热量交换和湖水湍流混合3个过程控制,存在明显的日变化。白天,“皮肤效应”主要取决于太阳辐射对上层水体的加热作用,通常表现为暖“皮肤效应”;夜间,“皮肤效应”由水气界面的感热、潜热交换和净长波辐射共同决定,表现为冷“皮肤效应”[27, 29-30]。“皮肤效应”受气象要素影响显著,云量和风速分别通过改变太阳辐射强度和湍流混合强度影响“皮肤效应”[31-32]。
“皮肤效应”给湖泊温度响应气候变暖研究带来诸多挑战。首先,多数研究采用表层水温观测数据验证遥感反演得到的表面温度[33-34],虽然部分研究进行了表层水温至表面温度的转换[35-36],但由于湖泊地理位置、形态特征和气候条件存在差异,导致转换方程难以推广,且转换过程会带来约0.3 K的不确定性[18]。其次,为了量化湖泊变暖速率,通常采用多源遥感数据融合来延长时间序列[17]。由于卫星过境时间不同(表 1),若不考虑“皮肤效应”的日变化,仅采用固定数值将遥感反演得到的表面温度转换为表层水温势必带来误差[37]。而且,研究发现若不考虑“皮肤效应”,仅用表层水温计算湖泊感热和潜热通量存在10%高估[38]。因此,量化湖泊“皮肤效应”及其影响因素,不仅有助于准确验证遥感反演结果和计算湖气热量交换,还可更加科学地评估湖泊变暖速率。为此,本文提出以下两个科学问题:(1)在不同的时间尺度和天气条件下,湖泊“皮肤效应”特征如何?(2)若不考虑“皮肤效应”,表面温度和表层水温表征的湖泊升温速率有多大差异?
太湖中尺度通量网[39]拥有10余年(2010年6月至今)的多站点、高频且连续的表面温度和水温梯度观测数据,为回答以上两个科学问题提供了观测数据支撑。本文基于太湖中尺度通量网2011—2020年的辐射四分量、水温梯度和小气候观测数据,量化了不同时间尺度(日、季节与年际)上、不同天气条件(晴天大风、晴天小风、阴天大风和阴天小风)下太湖表面温度与表层水温的差异,以期为太湖物理、化学、生物和生态过程对气候变暖的响应研究提供参考。
1 数据与方法 1.1 研究区域太湖位于亚热带季风气候区,1981—2010年平均气温为16.2℃,年总降水量为1122 mm,年平均风速为2.6 m/s[40]。太湖是我国第三大淡水湖,水域面积约2338 km2,平均水深为1.9 m[41]。太湖中尺度通量网(图 1)始建于2010年6月,截止2020年底,该通量网一共有7个湖泊站点,按照建成顺序依次为梅梁湾站(MLW)、大浦口站(DPK)、避风港站(BFG)、小雷山站(XLS)、平台山站(PTS)、东太湖站(DTH)与新梅梁湾站(MLW2)。

|
图 1 太湖中尺度通量网观测平台:左图为太湖中尺度通量网站点分布,右图为避风港站(BFG)(四源净辐射传感器(上)和水温梯度观测系统(下)实景,改自Lee等[39] Fig.1 The Taihu Eddy Flux Network and instrument platform at the BFG site |
由于BFG站观测时间长(始于2011年12月15日)、数据质量优[40-42],本文以BFG站2012—2020年0.5 h的20 cm水温(T20)、50 cm水温(T50)、辐射四分量和小气候观测资料为基础,选择MLW站(建于2010年6月)2011年观测数据为补充,并以距离BFG站最近的东山站(站号:58358)2011—2020年的气温观测数据(http://data.cma.cn)为参考。BFG站2014年水温梯度数据缺测最少(< 6%)[40],故选取BFG站2013年12月1日—2014年11月30日一整年的观测数据,来分析太湖各层水温的日变化、季节变化以及不同天气条件下的“皮肤效应”。
BFG站小气候系统架设高度为8.5 m,由温湿度传感器(型号:HMP155A;公司:Vaisala)和风速风向计(型号:05103;公司:R.M.Young)组成,分别用于观测空气温度、湿度、风速和风向。水温梯度观测系统(型号:109-L;公司:Campbell Scientific)用于观测水面以下20、50、100和150 cm的水温以及底泥温度。四源净辐射传感器(型号:CNR4;公司:Kipp & Zonen B.V)架设高度为2.5 m,用于测量向下短波辐射、向上短波辐射、向下长波辐射和向上长波辐射[42-43]。参考Zhang等[40]的方法对BFG站的水温和辐射数据进行以下质量控制和缺测插补。首先,根据BFG站的气候条件设定各变量的阈值,水温变化范围为-5~45℃,向下短波辐射(K↓)变化范围为0~1200 W/m2,向上短波辐射(K↑)变化范围为0~200 W/m2,向上长波辐射(L↑)变化范围为300~600 W/m2,向下长波辐射(L↓)变化范围为150~550 W/m2,剔除超出阈值范围的异常点。其次,运用五点滑动平均两倍标准差方法剔除异常值。数据插补分两步,若缺测时长短于1 h,进行线性内插;若缺测时长超过1 h,采用邻近站点的相同变量观测值插补,即将BFG站不同年份、不同季节的原始数据与其它站点的原始数据进行回归,选择相关系数最高的站点,利用该回归方程对BFG站缺失数据进行插补。质量控制和缺测插补完成后,再运用五点滑动平均两倍标准差方法剔除异常值,并对剔除后的数据进行插补,直至没有空缺。BFG站2013年12月1日—2014年11月30日水温和辐射数据插补后的时间序列如图 2所示。

|
图 2 BFG站2013年12月1日—2014年11月30日20 cm处水温T20(a)、50 cm处水温T50(b)、向上短波辐射K↑(c)、向下短波辐射K↓(d)、向上长波辐射L↑(e)和向下长波辐射L↓(f)原始数据(蓝色)与插补数据(红色)的时间序列 Fig.2 The time series of raw data (blue) and gap-filled data(red) of T20(a), T50(b), K↑(c), K↓(d), L↑(e) and L↓(f) from December 1, 2013 to November 30, 2014 at the BFG site |
基于四源净辐射传感器观测的向上长波辐射L↑和向下长波辐射L↓,根据Stefan-Boltzmann定律计算湖泊表面温度Ts,即:
| $T_{\mathrm{s}}=\left[\frac{L_{\uparrow}-(1-\varepsilon) L_{\downarrow}}{\varepsilon \cdot \sigma}\right]^{\frac{1}{4}}$ | (1) |
式中,ε为湖面比辐射率,取值为0.97[44];σ为Stefan-Boltzmann常数,为5.6696×10⁻⁸ W/(m2·K4)。
从观测设备维护和数据交叉验证两个方面保证湖面温度数据的可靠性。首先,每月对太湖中尺度通量网各站点的四源净辐射传感器进行镜头擦拭与水平校准,每年将生产商校准过的同款四源净辐射传感器安装在各站点平行观测10天,对比显示测量偏差小于1.0 W/m2。其次,对比BFG站建站第一年红外测温传感器(型号:SI-411;公司:Apogee Instruments Inc.)观测结果与式(1)计算的湖面温度,两者的相关系数和一致性系数均超过0.99,平均绝对误差为0.1 K。依据表层水温观测规范[45]和太湖已有观测试验[46],结合本研究水温梯度观测实际,以湖面温度(Ts)和20、50 cm深度处水温(T20、T50)的差值Ts-T20和Ts-T50来量化太湖水温的“皮肤效应”。
1.3.2 天气状况的确定本文采用晴空指数(Kt)来区分晴天和阴天。晴空指数指某一太阳高度角下地表水平面上接受的太阳总辐射S(W/m2)与大气上界水平面上的天文辐射Se(W/m2)的比值[47]。
| $K_{\mathrm{t}}=\frac{S}{S_{\mathrm{e}}}$ | (2) |
| $S_{\mathrm{e}}=S_{\mathrm{sc}}\left[1+0.033 \cos \left(360 t_{\mathrm{d}} / 365\right)\right] \sin \beta$ | (3) |
式中,Ssc为太阳常数,取1367 W/m2;td为日序;β为太阳高度角。定义Kt> 0.6时为晴天,Kt < 0.3时为阴天[47]。
基于BFG 0.5 h风速观测数据,采用分位数法定义大风和小风。风速高于75%分位数时(Ws> 5.8 m/s)为大风,低于25%分位数时(Ws < 3.2 m/s)为小风。
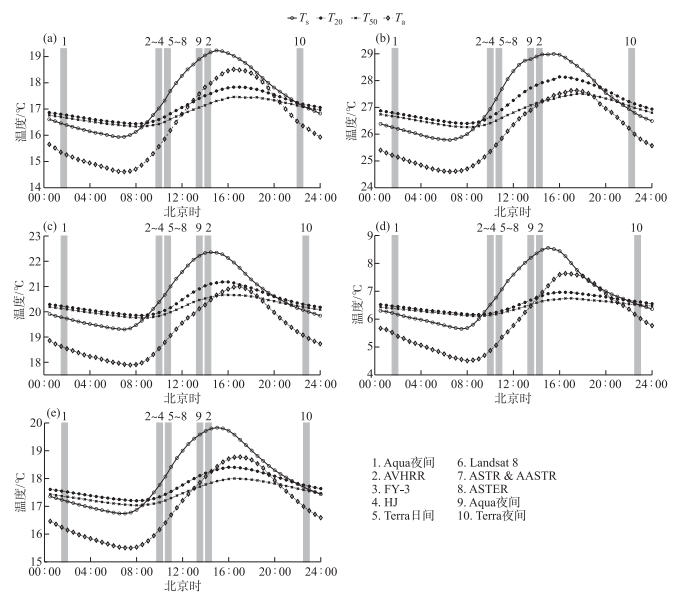
2 结果与讨论 2.1 太湖水温多尺度时间变化特征 2.1.1 太湖表面温度和表层水温的日变化太湖BFG站四季和年平均的Ts、T20和T50皆呈单峰型日变化(图 3)。从年平均日变化来看(图 3e),夜间湖面向上发射的长波辐射大于大气逆辐射,长波辐射冷却使得与大气直接接触的表面温度迅速降低,低于表层水温,表现为冷“皮肤效应”,7:00—8:00最强,此时Ts分别比T20和T50低0.50和0.34℃。白天,太阳辐射加热使湖面迅速升温,且升温速率快于表层水温,使得表面温度逐渐高于表层水温,表现为暖“皮肤效应”,15:00—16:00最强,此时Ts分别比T20和T50高1.54和1.95℃。此外,由于表层水温白天升温和夜晚降温速率均慢于表面温度,其日变化曲线滞后于表面温度,且随着深度增加,日变化幅度减小,滞后愈加明显。
研究卫星在太湖过境时刻的“皮肤效应”,不仅可以量化表层水温验证遥感反演表面温度结果时的误差,还可以为多源遥感产品融合构建太湖水温长时间序列提供参考。常用于表面温度反演的卫星热红外传感器在太湖过境时的Ts与T20、Ts与T50的差值如表 1所示。以年平均日变化为例,AVHRR日间过境时(14:00),暖“皮肤效应”显著,Ts- T20和Ts-T50分别为1.38和1.73℃;凌晨过境时(2:00)呈冷“皮肤效应”,强度明显降低,Ts-T20和Ts-T50分别为-0.42和-0.32℃。MODIS-Aqua凌晨过境(01:30)和午后(13:30)过境时,太湖水温呈现与AVHRR类似的“皮肤效应”昼夜对比特征。01:30时Ts-T20和Ts-T50分别为-0.40和-0.29℃;13:30时Ts-T20和Ts-T50分别为1.35和1.64℃。其他卫星多在10:00—10:30过境,此时太湖水温暖“皮肤效应”数值约为峰值的一半。如Landsat的TM/ETM+/TIRS传感器、环境资源卫星(HJ)的IRS传感器、FY-3的MERSI与VIRR传感器以及ENVISAT-AATSR过境时,Ts-T20和Ts-T50在0.58~0.75℃之间。
太湖“皮肤效应”强度在四季之间存在差异。暖“皮肤效应”在春季最强,Ts-T20和Ts-T50最大值分别为1.54和1.90℃;夏季最弱,最大值分别为1.07和1.44℃。秋冬两季介于春夏之间,秋季Ts-T20和Ts-T50最大值分别为1.30和1.81℃,冬季分别为1.59和1.77℃。可见,由于“皮肤效应”的存在,表层水温观测值无法直接验证卫星午后过境反演得到的太湖湖面温度,特别是在春季,其偏差最大接近2℃。在夜间,这种验证带来的偏差小于0.5℃。
|
图 3 2013年12月—2014年11月BFG站表面温度(Ts)、20 cm处水温(T20)、50 cm处水温(T50)和气温(Ta)的平均日变化(a:春季;b:夏季;c:秋季;d:冬季;e:年平均)(图中阴影表示各卫星传感器过境太湖的时刻) Fig.3 Diurnal variations in the surface temperature (Ts), the water temperature at 20 cm depth (T20), the water temperature at 50 cm depth (T50) and the air temperature (Ta) at the BFG site from December 2013 to November 2014 (a: spring; b: summer; c: autumn; d: winter; e: annual mean) (The passing over time of each satellites are denoted by the gray bars) |
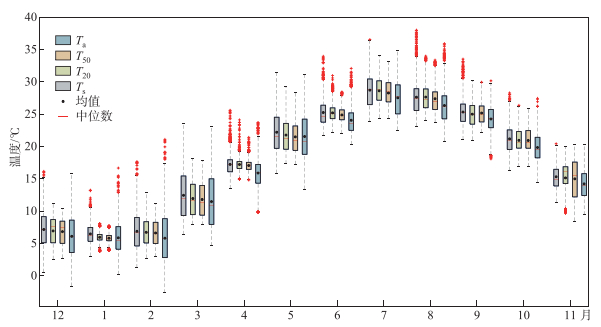
2013年12月—2014年11月BFG站Ts、T20和T50月均值的季节变化如图 4所示。太湖水温呈夏高冬低的季节变化特征,水温在春季开始升高,7月达到峰值,月均值接近30℃,其后水温下降,1月降至最低,月均值约为6℃。
相较于日尺度,季节尺度上太湖表面温度与表层水温之间差异更小,这与太湖的浅水特性有关[44-45]。太湖水温在3和5月存在微弱的热力分层,Ts-T20和Ts-T50分别为0.65和0.71℃。除1月外,冬季Ts-T50均小于0.4℃。虽然1月气温全年最低(5.8℃)、太阳辐射较弱(110 W/m2),但该月风速(4.1 m/s)低于年平均风速(4.9 m/s),低风速抑制了湖水的动力混合,可能导致该月呈现微弱的“皮肤效应”,Ts-T20和Ts-T50分别为0.53和0.67℃。
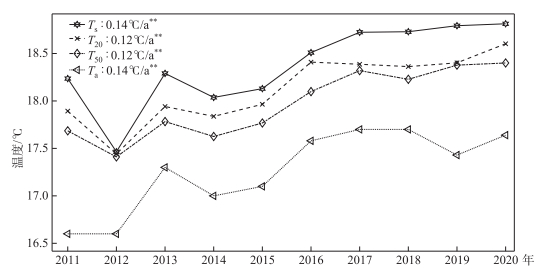
2.1.3 太湖表面温度和表层水温的年际变化特征太湖表面温度和表层水温在年际尺度上均呈上升趋势(图 5)。10年中,Ts、T20和T50年均最低值均出现在2012年,分别为17.5、17.4和17.4℃,最高值均出现在2020年,分别为18.8、18.5和18.4℃。10年间,太湖水温升温速率随深度增加而递减。Ts升温速率最快,为0.14℃/a(P < 0.01),T20和T50的升温速率相当,均为0.12℃/a(P < 0.05)。对比东山站同期2 m气温可见,10年间,气温数值均低于BFG站3层水温,但上升趋势与水温一致,升温速率与Ts接近,为0.14℃/a(P < 0.01)。此外,从10年间温度波动来看,太湖表面温度的标准差与气温相当,均为0.43℃,高于T20和T50的标准差(0.36℃)。可见,太湖表面温度能快速响应气象条件变化,升温速率与气温相当,但比表层水温升温速率快0.02℃/a。
| 表 1 卫星传感器过境时太湖表面温度(Ts)与20 cm处水温(T20)和50 cm处水温(T50)的差值 Tab. 1 The difference between the surface temperature (Ts) and water temperature at 20 cm depth (T20) or at 50 cm depth (T50) when satellites pass over Lake Taihu |
|
图 4 2013年12月—2014年11月BFG站表面温度(Ts)、20 cm处水温(T20)、50 cm处水温(T50)和气温(Ta)的季节变化箱式图 Fig.4 Box plot of seasonal variation in surface temperature (Ts), water temperature at 20 cm depth (T20), water temperature at 50 cm depth (T50) and the air temperature (Ta) at the BFG site from December 2013 to November 2014 |
|
图 5 BFG站表面温度(Ts)、20 cm处水温(T20)、50 cm处水温(T50)和DS站气温(Ta)的年际变化(**表示年际变化趋势在0.01水平上显著,*表示年际变化趋势在0.05水平上显著) Fig.5 Interannual variations in surface temperature (Ts), water temperature at 20 cm depth (T20), water temperature at 50 cm depth (T50) at the BFG site and air temperature at the DS site |
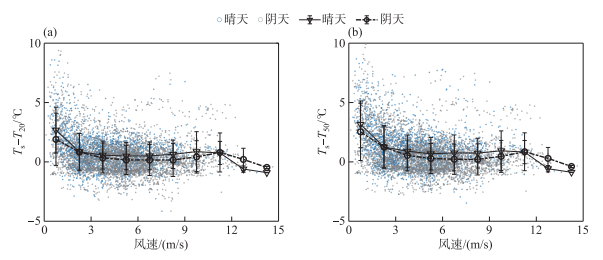
由图 6可见,“皮肤效应”数值随风速增大而减小,除风速大于11 m/s外,晴天时Ts-T20和Ts-T50均较阴天时更大。晴天时,当风速小于0.5 m/s时,Ts-T20和Ts-T50数值均超过3℃,随着风速增大,Ts-T20和Ts-T50迅速减小。当风速达到2.5 m/s后,Ts-T20和Ts-T50随风速增加趋于平稳。当风速超过8 m/s时,Ts-T20与Ts-T50的数值趋于零,此时各层湖水均匀混合,这与Yang等[31]研究结果一致。阴天时,Ts-T20与Ts-T50随风速增大而减小的趋势与晴天结果一致,但Ts-T20与Ts-T50的数值比晴天时小0.15~0.28℃。可见,晴天与阴天条件下,太湖水温的“皮肤效应”随风速的变化幅度高达3℃,与Prats等[35]的研究结果相近。而风速相同时,晴天比阴天的“皮肤效应”最多高0.5℃。
|
图 6 BFG站晴天与阴天条件下Ts-T20(a)、Ts-T50(b)随风速的变化(▽和○分别代表晴天和阴天条件下的区间平均值,区间大小为1.5 m/s,对应的误差线为区间内观测值的标准差) Fig.6 Changes of Ts-T20 (a) and Ts-T50 (b) with wind speed under clear-sky and cloudy conditions at the BFG site (The triangle and the circle are the means of the intervals under clear-sky and cloudy conditions, respectively. The width of the interval is 1.5 m/s, and the corresponding error bar is standard deviation) |
大风条件下,随着晴空指数Kt增加,Ts-T20和Ts-T50呈现先增后减的变化特征(图 7a)。当Kt < 0.5时,Ts-T20和Ts-T50随Kt增加而增大;当Kt接近于0.5时,达到峰值;当Kt>0.5时,温差随Kt增加而下降。小风条件下,Ts-T20和Ts-T50随晴空指数的变化趋势与大风时结果一致,但数值更大(图 7b)。大风和小风时Ts-T20和Ts-T50的差异在Kt接近0.5时最大,分别为1.19和1.85℃。随着Kt偏离0.5,差异减小。当Kt接近于1时,两者无明显差异。Kt接近于0时,“皮肤效应”在大风条件下虽然接近于0,但在小风条件下依然能观测到约1℃的正“皮肤效应”。
如图 8所示,太湖水温“皮肤效应”随着太阳辐射增强而增大,且增大趋势在小风天气下更加明显。当K↓由50 W/m2增至950 W/m2时,大风条件下,Ts-T20和Ts-T50均增加了1℃;小风条件下,Ts-T20和Ts-T50分别增加了1.9和2.3℃。当K↓=50 W/m2时,大风和小风条件下的“皮肤效应”差异不足0.4℃,但两者之间的差异随着K↓增强而增大;当K↓=950 W/m2时,大风和小风条件下的“皮肤效应”差异达到1.9℃。

|
图 7 BFG站点大风与小风条件下Ts-T20(a)、Ts-T50(b)随晴空指数的变化(□和△分别代表小风和大风条件下的区间平均值,区间大小为0.2,对应的误差线为区间内观测值的标准差) Fig.7 Changes of Ts-T20(a) and Ts-T50(b) with clearness index under strong wind and weak wind conditions at the BFG site(The square and the triangle are the means of the intervals under the conditions of weak wind and strong wind, respectively. The width of the interval is 0.2, and the corresponding error bar is standard deviation) |
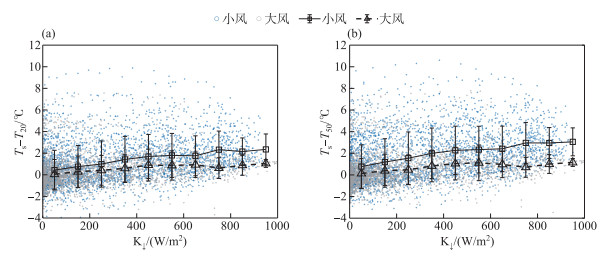
|
图 8 BFG站点大风与小风条件下Ts-T20(a)、Ts-T50(b)随太阳辐射的变化(□和△分别代表小风和大风条件下的区间平均值,区间大小为100 W/m2,对应的误差线为区间内观测值的标准差) Fig.8 Changes of Ts-T20(a) and Ts-T50(b) with solar radiation under strong wind and weak wind conditions at the BFG site(The square and the triangle are the means of the intervals under the conditions of weak wind and strong wind, respectively. The size of the interval is 100 W/m2, and the corresponding error bar is standard deviation) |

|
图 9 4种天气条件下太湖表面温度与表层水温差异(Ts-T20和Ts-T50)的小提琴图 Fig.9 The violin plot of the difference between the surface temperature and the bulk temperature of Lake Taihu (Ts-T20 and Ts-T50) under four different weather conditions |

|
图 10 BFG站点晴天(a)和阴天(b)条件下Ts-T20随风速变化的拟合曲线 Fig.10 Fitting curves of Ts-T20 with wind speed at the BFG site under clear-sky (a) and cloudy (b) conditions |
晴天小风时Ts-T20和Ts-T50最大(图 9),均值分别为1.23和1.64℃,中位数分别为0.95和1.39℃。阴天大风时Ts-T20和Ts-T50最小,均值分别为0.32和0.39℃,中位数分别为0.14和0.19℃。可见在晴天小风条件下,太湖“皮肤效应”最显著,这与以往研究结果一致[17, 26-27, 31, 35, 48]。而较弱的太阳辐射与强风速带来的湖水混合,使太湖观测不到热力分层。阴天小风下Ts-T20和Ts-T50均值分别为1.04和1.49℃,与晴天小风时结果最为接近,但强于晴天大风下的结果(0.58和0.77℃)。结合图 7、8和9可知,相较于太阳辐射,风速对于太湖水温“皮肤效应”的影响更大,说明对于太湖这样的浅水湖泊而言,风的扰动是影响湖水热力分层的主要因素。Yang等[31]指出太湖水体在日尺度上的对流主要由风扰动引起,风可以驱动湖水的湍流运动,使水体上下混合均匀,从而减弱“皮肤效应”。鉴于风速对“皮肤效应”的重要性,诸多研究提出了利用风速计算“皮肤效应”的参数化方案[19, 28, 49-50]。但这些参数方案均源自海洋观测,会严重低估太湖水温的“皮肤效应”,在低风速时尤为明显(图 10)。为此,根据太湖观测数据,本文给出了晴天条件下适用于太湖的“皮肤效应”的风速参数化方案为:ΔT= 0.4885+6.359exp(-1.173Ws),阴天条件下适用于太湖的“皮肤效应”的风速参数化方案为:ΔT= 0.1639+3.498exp(-0.7639Ws)(图 10)。Ts-T50随风速变化的拟合结果与Ts-T20类似。
基于太湖中尺度通量网10年的表面温度和表层水温观测数据,得到太湖水温“皮肤效应”白天为正、夜间为负,这一昼夜变化特征与以往研究结果一致[18, 27, 35],但不同内陆水体间的“皮肤效应”数值存在差异。如法国Bimont Reservoir在上午10:00时水下55 cm处“皮肤效应”约为0.34℃[35],低于本文结果(0.86℃)。美国Lake Tahoe[24-25]、Lake Ramsey[51]的“皮肤效应”常年为负值,主要是因为表层水温观测深度较浅(2~5 cm),该薄层内水温主要受分子热传导控制,使得该观测深度处水温常年高于表面温度。作为典型的大型浅水湖泊,太湖观测的暖“皮肤效应”在午后接近2℃,可以推断深水湖泊暖“皮肤效应”会更强,利用表层水温观测值直接验证卫星反演的深水湖泊表面温度带来的误差可能更大。
太湖表面温度和表层水温的升温趋势与气温一致,尤其是表面温度(图 5),这与以往研究结果一致[6, 47, 52-55]。太湖升温速率明显高于Sharma等[5](0.3℃/(10 a))和Schneider等[3](0.13℃/(10 a))得到的全球湖泊的平均升温速率,这一差异可能与研究时段不同有关。若将研究时段固定在2010—2019年,张运林等[46]研究发现50 cm处太湖水温升温速率为1.79℃/(10 a),高于本研究的结果(1.13℃/(10 a)),这一差异可能与水温观测站点的选取有关。张运林等[46]采用太湖栈桥水域每日2:00、14:00与20:00 3个时刻50 cm处水温观测数据,该观测点离岸约50 m,易受周边人为活动等的影响。本研究的BFG站离岸最近距离超过4 km,观测数据受周边环境影响较小。对于大型湖泊,采用近岸观测数据可能会高估湖泊升温速率,有必要在湖泊中心开展观测,以客观地表征湖泊水体的升温速率。表面温度和表层水温都可以用来量化湖泊升温速率[3, 5-6, 46, 52-55]。太湖近10年观测数据显示其表面温度上升速率比50 cm处水温上升速率快0.02℃/a,若不考虑“皮肤效应”,直接使用遥感反演的表面温度表征的太湖升温速率会比传统的表层水温观测结果快0.02℃/a。
3 结论基于太湖2011—2020年辐射四分量、水温梯度和小气候观测数据,量化了不同时间尺度(日、季节与年际)上、不同天气条件(晴天大风、晴天小风、阴天大风和阴天小风)下太湖表面温度与表层水温的差异,结论如下:
1) 太湖四季和年平均的Ts、T20和T50皆呈现单峰型日变化。暖“皮肤效应”在15:00—16:00最强,Ts-T20和Ts-T50分别为1.54和1.95℃;冷“皮肤效应”在7:00—8:00最强,Ts-T20和Ts-T50分别为-0.50和-0.34℃。“皮肤效应”强度春季最强,Ts-T20和Ts-T50日最大值为1.54~1.90℃;夏季最弱,Ts-T20和Ts-T50日最大值为1.07~1.44℃。用表层水温观测值直接验证卫星午后过境反演得到的太湖湖面温度,其偏差接近2℃,尤其在春季。在夜间,验证偏差小于0.5℃。
2) 太湖Ts、T20和T50均呈夏高冬低的季节变化特征,三层水温数值差异不显著。太湖表面温度与表层水温的在年际尺度上均呈上升趋势,其中Ts上升最快,为0.14℃/a(P < 0.01),与同期气温上升速率相当。T20和T50的上升速率均为0.12℃/a(P < 0.05)。直接使用遥感反演的表面温度表征的太湖升温速率会比传统的表层水温观测结果快0.02℃/a。
3) 晴天小风时暖“皮肤效应”最显著,Ts-T20和Ts-T50均值分别为1.23和1.64℃;阴天大风时“皮肤效应”最不显著,Ts-T20和Ts-T50均值分别为0.32和0.39℃。相较于太阳辐射,风速对太湖水温“皮肤效应”的影响更大。现有的参数方案会低估太湖水温的“皮肤效应”,在低风速时尤为明显。基于10年观测数据建立了适用于太湖晴天和阴天条件下“皮肤效应”风速参数化方案。
| [1] |
Adrian R, O'Reilly CM, Zagarese H et al. Lakes as sentinels of climate change. Limnology and Oceanography, 2009, 54(6): 2283-2297. DOI:10.4319/lo.2009.54.6_part_2.2283 |
| [2] |
Schneider P, Hook SJ. Space observations of inland water bodies show rapid surface warming since 1985. Geophysical Research Letters, 2010, 37(22): L22405. DOI:10.1029/2010gl045059 |
| [3] |
Schneider P, Hook SJ, Radocinski RG et al. Satellite observations indicate rapid warming trend for lakes in California and Nevada. Geophysical Research Letters, 2009, 36(22): L22402. DOI:10.1029/2009gl040846 |
| [4] |
O'Reilly CM, Sharma S, Gray DK et al. Rapid and highly variable warming of lake surface waters around the globe. Geophysical Research Letters, 2015, 42(24): 773-781. DOI:10.1002/2015GL066235 |
| [5] |
Sharma S, Gray DK, Read JS et al. A global database of lake surface temperatures collected by in situ and satellite methods from 1985-2009. Scientific Data, 2015, 2(1): 1-19. DOI:10.1038/sdata.2015.8 |
| [6] |
Xie C, Zhang X, Zhuang L et al. Analysis of surface temperature variation of lakes in China using MODIS land surface temperature data. Scientific Reports, 2022, 12(1): 1-13. DOI:10.1038/s41598-022-06363-9 |
| [7] |
Woolway RI, Jennings E, Shatwell T et al. Lake heatwaves under climate change. Nature, 2021, 589(7842): 402-407. DOI:10.1038/s41586-020-03119-1 |
| [8] |
Lawrence DM, Fisher RA, Koven CD et al. The community land model version 5: Description of new features, benchmarking, and impact of forcing uncertainty. Journal of Advances in Modeling Earth Systems, 2019, 11(12): 4245-4287. DOI:10.1029/2018ms001583 |
| [9] |
Henderson-Sellers B. Calculating the surface energy balance for lake and reservoir modeling: A review. Reviews of Geophysics, 1986, 24(3): 625-649. DOI:10.1029/rg024i003p00625 |
| [10] |
Moukomla S, Blanken P. Remote sensing of the North American laurentian great lakes' surface temperature. Remote Sensing, 2016, 8(4): 286. DOI:10.3390/rs8040286 |
| [11] |
Piccolroaz S, Toffolon M, Majone B. A simple lumped model to convert air temperature into surface water temperature in lakes. Hydrology and Earth System Sciences, 2013, 17(8): 3323-3338. DOI:10.5194/hess-17-3323-2013 |
| [12] |
Kraemer BM, Chandra S, Dell AI et al. Global patterns in lake ecosystem responses to warming based on the temperature dependence of metabolism. Global Change Biology, 2017, 23(5): 1881-1890. DOI:10.1111/gcb.13459 |
| [13] |
Gillooly JF, Brown JH, West GB et al. Effects of size and temperature on metabolic rate. Science, 2001, 293(5538): 2248-2251. DOI:10.1126/science.1061967 |
| [14] |
Yang P, Tong C, He QH et al. Greenhouse gases fluxes at water-air interface of aquaculture ponds and influencing factors in the Min River estuary. Acta Scientiae Circumstantiae, 2013, 33(5): 1493-1503. [杨平, 仝川, 何清华等. 闽江口鱼虾混养塘水-气界面温室气体通量及主要影响因子. 环境科学学报, 2013, 33(5): 1493-1503. DOI:10.13671/j.hjkxxb.2013.05.018] |
| [15] |
Wik M, Varner RK, Anthony KW et al. Climate-sensitive northern lakes and ponds are critical components of methane release. Nature Geoscience, 2016, 9(2): 99-105. DOI:10.1038/ngeo2578 |
| [16] |
Brookes JD, Carey CC. Ecology. resilience to blooms. Science, 2011, 334(6052): 46-47. DOI:10.1126/science.1207349 |
| [17] |
Riffler M, Lieberherr G, Wunderle S. Lake surface water temperatures of European Alpine lakes (1989-2013) based on the Advanced Very High Resolution Radiometer (AVHRR) 1 km data set. Earth System Science Data, 2015, 7(1): 1-17. DOI:10.5194/essd-7-1-2015 |
| [18] |
Hulley GC, Hook SJ, Schneider P. Optimized split-window coefficients for deriving surface temperatures from inland water bodies. Remote Sensing of Environment, 2011, 115(12): 3758-3769. DOI:10.1016/j.rse.2011.09.014 |
| [19] |
Donlon CJ, Minnett PJ, Gentemann C et al. Toward improved validation of satellite sea surface skin temperature measurements for climate research. Journal of Climate, 2002, 15(4): 353-369. DOI:10.1175/1520-0442(2002)0150353:tivoss>2.0.co;2 |
| [20] |
Schluessel P, Emery WJ, Grassl H et al. On the bulk-skin temperature difference and its impact on satellite remote sensing of sea surface temperature. Journal of Geophysical Research, 1990, 95(C8): 13341. DOI:10.1029/jc095ic08p13341 |
| [21] |
Yan FL, Wu L, Wang SX et al. Review of watersurface temperature inversion. Journal of Geo-information Science, 2014, 17(8): 969-978. [阎福礼, 吴亮, 王世新等. 水体表面温度反演研究综述. 地球信息科学学报, 2014, 17(8): 969-978. DOI:10.3724/SP.J.1047.2015.00969] |
| [22] |
Minnett PJ, Alvera-Azcárate A, Chin TM et al. Half a century of satellite remote sensing of sea-surface temperature. Remote Sensing of Environment, 2019, 233: 111366. DOI:10.1016/j.rse.2019.111366 |
| [23] |
Gong SQ, Dong GK, Sun DY et al. Application of HJ/IRS to retrieve water surface temperature in Lake Taihu, China. In: International Conference on Information Science and Technology. Nanjing, China: IEEE, 2011: 560-565. DOI: 10.1109/ICIST.2011.5765313.
|
| [24] |
Wilson RC, Hook SJ, Schneider P et al. Skin and bulk temperature difference at Lake Tahoe: A case study on lake skin effect. Journal of Geophysical Research: Atmospheres, 2013, 118(18): 10332-10346. DOI:10.1002/jgrd.50786 |
| [25] |
Hook SJ, Prata FJ, Alley RE et al. Retrieval of lake bulk and skin temperatures using along-track scanning radiometer (ATSR-2) data: A case study using lake tahoe, California. Journal of Atmospheric and Oceanic Technology, 2003, 20(4): 534-548. DOI:10.1175/1520-0426(2003)20534:rolbas>2.0.co;2 |
| [26] |
Saunders PM. The temperature at the ocean-air interface. Journal of the Atmospheric Sciences, 1967, 24(3): 269-273. DOI:10.1175/1520-0469(1967)0240269:ttatoa>2.0.co;2 |
| [27] |
Minnett PJ. Radiometric measurements of the sea-surface skin temperature: The competing roles of the diurnal thermocline and the cool skin. International Journal of Remote Sensing, 2003, 24(24): 5033-5047. DOI:10.1080/0143116031000095880 |
| [28] |
Minnett PJ, Smith M, Ward B. Measurements of the oceanic thermal skin effect. Deep Sea Research Part Ⅱ: Topical Studies in Oceanography, 2011, 58(6): 861-868. DOI:10.1016/j.dsr2.2010.10.024 |
| [29] |
Fairall CW, Bradley EF, Godfrey JS et al. Cool-skin and warm-layer effects on sea surface temperature. Journal of Geophysical Research: Oceans, 1996, 101(C1): 1295-1308. DOI:10.1029/95jc03190 |
| [30] |
Robinson IS, Wells NC, Charnock H. The sea surface thermal boundary layer and its relevance to the measurement of sea surface temperature by airborne and spaceborne radiometers. International Journal of Remote Sensing, 1984, 5(1): 19-45. DOI:10.1080/01431168408948787 |
| [31] |
Yang YC, Wang YW, Zhang Z et al. Diurnal and seasonal variations of thermal stratification and vertical mixing in a shallow fresh water lake. Journal of Meteorological Research, 2018, 32(2): 219-232. DOI:10.1007/s13351-018-7099-5 |
| [32] |
Zhang YC, Qian X, Qian Y et al. Field measurement and analysis on diurnal stratification in Taihu Lake. Environmental Science and Management, 2008, 33(6): 117-121. [张玉超, 钱新, 钱瑜等. 太湖水温分层现象的监测与分析. 环境科学与管理, 2008, 33(6): 117-121. DOI:10.3969/j.issn.1673-1212.2008.06.034] |
| [33] |
Crosman ET, Horel JD. MODIS-derived surface temperature of the Great Salt Lake. Remote Sensing of Environment, 2009, 113(1): 73-81. DOI:10.1016/j.rse.2008.08.013 |
| [34] |
Grim JA, Knievel JC, Crosman ET. Techniques for using MODIS data to remotely sense lake water surface temperatures. Journal of Atmospheric and Oceanic Technology, 2013, 30(10): 2434-2451. DOI:10.1175/jtech-d-13-00003.1 |
| [35] |
Prats J, Reynaud N, Rebière D et al. LakeSST: Lake Skin Surface Temperature in French inland water bodies for 1999-2016 from Landsat archives. Earth System Science Data, 2018, 10(2): 727-743. DOI:10.5194/essd-10-727-2018 |
| [36] |
Jessup AT, Branch R. Integrated Ocean skin and bulk temperature measurements using the calibrated infraredin situ measurement system (CIRIMS) and through-hull ports. Journal of Atmospheric and Oceanic Technology, 2008, 25(4): 579-597. DOI:10.1175/2007jtecho479.1 |
| [37] |
Pareeth S, Bresciani M, Buzzi F et al. Warming trends of perialpine lakes from homogenised time series of historical satellite and in situ data. Science of the Total Environment, 2017, 578: 417-426. DOI:10.1016/j.scitotenv.2016.10.199 |
| [38] |
Oppenheimer C. Ramifications of the skin effect for crater lake heat budget analysis. Journal of Volcanology and Geothermal Research, 1997, 75(1/2): 159-165. DOI:10.1016/S0377-0273(96)00037-6 |
| [39] |
Lee XH, Liu SD, Xiao W et al. The Taihu eddy flux network: An observational program on energy, water, and greenhouse gas fluxes of a large freshwater lake. Bulletin of the American Meteorological Society, 2014, 95(10): 1583-1594. DOI:10.1175/bams-d-13-00136.1 |
| [40] |
Zhang Z, Zhang M, Cao C et al. A dataset of microclimate and radiation and energy fluxes from the Lake Taihu eddy flux network. Earth System Science Data, 2020, 12(4): 2635-2645. DOI:10.5194/essd-12-2635-2020 |
| [41] |
Jing SJ, Xiao W, Wang W et al. Evaluation on the performance of CLM4-LISSS in simulating water and heat fluxes at multiple time scales over Lake Taihu. J Lake Sci, 2019, 31(6): 1698-1712. [荆思佳, 肖薇, 王伟等. CLM4-LISSS模型对太湖多时间尺度水热通量模拟性能的评估. 湖泊科学, 2019, 31(6): 1698-1712. DOI:10.18307/2019.0611] |
| [42] |
Xiao QT, Duan HT, Zhang M et al. Waterside convective velocity in a large and shallow lake: A case of Lake Taihu. J Lake Sci, 2020, 32(4): 1189-1198. [肖启涛, 段洪涛, 张弥等. 大型浅水湖泊水体对流混合速率分析. 湖泊科学, 2020, 32(4): 1189-1198. DOI:10.18307/2020.0425] |
| [43] |
Wang DD, Wang W, Liu SD et al. Characteristics of modelling hourly water surface evaporation in Lake Taihu and comparison of simulation results by three models. J Lake Sci, 2017, 29(6): 1538-1550. [王丹丹, 王伟, 刘寿东等. 太湖小时尺度水面蒸发特征及3种模型模拟效果对比. 湖泊科学, 2017, 29(6): 1538-1550. DOI:10.18307/2017.0626] |
| [44] |
Wang W, Xiao W, Cao C et al. Temporal and spatial variations in radiation and energy balance across a large freshwater lake in China. Journal of Hydrology, 2014, 511: 811-824. DOI:10.1016/j.jhydrol.2014.02.012 |
| [45] |
生态环境部. 地表水环境质量监测技术规范. 中华人民共和国国家生态环境标准, 2022. HJ 91.2—2022.
|
| [46] |
Zhang YL, Qin BQ, Zhu GW. Long-term changes in physical environments and potential implications for the eco-environment of Lake Taihu in the past four decades. J Lake Sci, 2020, 32(5): 1348-1359. [张运林, 秦伯强, 朱广伟. 过去40年太湖剧烈的湖泊物理环境变化及其潜在生态环境意义. 湖泊科学, 2020, 32(5): 1348-1359. DOI:10.18307/2020.0503] |
| [47] |
Gu LH, Fuentes JD, Shugart HH et al. Responses of net ecosystem exchanges of carbon dioxide to changes in cloudiness: Results from two North American deciduous forests. Journal of Geophysical Research: Atmospheres, 1999, 104(D24): 31421-31434. DOI:10.1029/1999jd901068 |
| [48] |
Deng B, Liu SD, Xiao W et al. Evaluation of the CLM4 lake model at a large and shallow freshwater lake. Journal of Hydrometeorology, 2013, 14(2): 636-649. DOI:10.1175/jhm-d-12-067.1 |
| [49] |
Horrocks LA. Parameterizations of the ocean skin effect and implications for satellite-based measurement of sea-surface temperature. Journal of Geophysical Research, 2003, 108(C3): 3096. DOI:10.1029/2002jc001503 |
| [50] |
Gentemann CL, Minnett PJ. Radiometric measurements of ocean surface thermal variability. Journal of Geophysical Research, 2008, 113(C8): C08017. DOI:10.1029/2007jc004540 |
| [51] |
Hondzo M, You JQ, Taylor J et al. Measurement and scaling of lake surface skin temperatures. Geophysical Research Letters, 2022, 49(6): e2021GL093226. DOI:10.1029/2021gl093226 |
| [52] |
Wan W, Zhao L, Xie H et al. Lake surface water temperature change over the Tibetan Plateau from 2001 to 2015: A sensitive indicator of the warming climate. Geophysical Research Letters, 2018, 45(20): 11177-11186. DOI:10.1029/2018gl078601 |
| [53] |
Zhang YL, Qin BQ, Zhu GW et al. Profound changes in the physical environment of Lake Taihu from 25 years of long-term observations: Implications for algal bloom outbreaks and aquatic macrophyte loss. Water Resources Research, 2018, 54(7): 4319-4331. DOI:10.1029/2017wr022401 |
| [54] |
Livingstone DM, Dokulil MT. Eighty years of spatially coherent Austrian lake surface temperatures and their relationship to regional air temperature and the North Atlantic Oscillation. Limnology and Oceanography, 2001, 46(5): 1220-1227. DOI:10.4319/lo.2001.46.5.1220 |
| [55] |
Wang R, Niu ZG. Characteristics of changes in lake temperature in China and their response to climate change. China Environmental Science, 2020, 40(2): 780-788. [王瑞, 牛振国. 中国湖泊温度变化特征及其对气候变化的响应. 中国环境科学, 2020, 40(2): 780-788.] |
 2023, Vol. 35

