(2: 福建省厦门环境监测中心站, 厦门 361022)
(2: Fujian Xiamen Environmental Monitoring Central Station, Xiamen 361022, P.R. China)
作为连接流域和海洋的区域,河口陆海相互作用强烈[1-2],受人为干扰强烈[3-4]。自工业时代以来,氮(N)和磷(P)营养负荷增加使得全球近岸水域的N/P失衡加剧[5-6]。水生生态系统中过多的营养负荷会导致富营养化风险增加,底层水域可能出现缺氧状况,即使水体保持一定的溶解氧,富营养化也会增加有机质对底层沉积物的输入[7]。过高的营养负荷还可导致溶解氧耗竭[8-9]、海草床和珊瑚礁等关键生境的丧失、以及包括生物多样性丧失在内的生态结构变化,使得有害藻类繁殖的发生率和持续时间增加[10]。
河流筑坝影响河流-河口连续体的水循环[11-13],延长了水力停留时间[14],可通过将N、P、硅(Si)等生源要素转化为颗粒形式、随后通过沉降或气体流失来驱动水体中营养物质的去除,从而改变河口N∶P∶Si[15]。当N和P的含量超过Si,有害藻类就会大量增殖[16-17],最终引起藻类群落结构的变化[18]。硅藻的生长潜力受到限制已经成为世界大部分地区富营养化沿海水域生物地球化学的一个共同特征[19]。富营养化和营养物质输入的大规模扰动,是有害藻类暴发的范围和持续时间呈增加趋势的原因之一[20]。河流向河口输送的N和P通量的增加加剧了河口的富营养化,输送的N、P通量相对Si的不平衡导致河口的营养结构和生物群落的改变[21-23],富营养化和化学计量比失衡与河口频繁发生的有害藻华存在密切关系[24]。Billen等[15]提出富营养化潜力指数(index of coastal eutrophication potential, ICEP),该指数是基于从河流中输入的溶解硅(DSi)相对于N和P输入的比例而确定的。ICEP方法已应用于欧洲许多流域、密西西比-阿查法拉亚河流域等。如欧洲许多流域的ICEP指数均呈现正值,表明河口近海受纳水体藻类暴发的可能性较大[25];ICEP也揭示了密西西比河主要支流中不同营养物质负荷的化学计量模式,以及密西西比河-阿查法拉亚河流域大部分内陆水域蓝藻暴发的风险增加[26]。而在全球范围内,与南太平洋和印度洋的数值相比,北大西洋的ICEP数值要高得多[24]。
尽管九龙江河口的集水面积相对较小,但发现该地区表现出较高的营养物质通量[27]。目前人们对九龙江河口富营养化的认识,主要依赖于单次或少数调查结果。然而,鉴于近海富营养化影响因素的复杂性,调查结果可能存在偶然性,很难全面反映人类活动和自然因素的影响。九龙江河口作为中小型的河口湾,相较于大型河口而言,对季节性和人类干扰响应更为灵敏,因此,本文尝试分析和建立九龙江营养通量增加与河口富营养化和藻类群落改变之间的耦合联系。基于此科学问题,本文通过收集并建立九龙江河口的较长时间序列的数据集,目的在于(1)分析主要营养盐N、P和Si比例的动态变化,并在此基础上揭示年际和季节尺度上九龙江河口ICEP的变化;(2)说明富营养化潜力指数的时间趋势与藻类群落变化的关系,评估ICEP动态变化和河口生态系统的响应以及驱动因素。
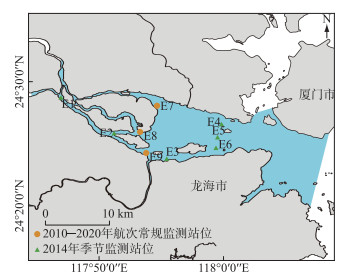
1 材料与方法 1.1 研究区概况九龙江河口位于福建东南沿海,是一个连接厦门湾和台湾海峡的浅海河口(图 1),其东西长约21 km,南北宽约6.5 km,水深3~16 m,总水域面积为100 km2,河口潮汐为非正规半日潮,平均潮差为2.7~4.0 m,该河口湾为径流与潮流相互作用的强潮海区[27-29]。九龙江是福建省第二大河流,主要由北溪、西溪组成,流域面积1.47×10⁴ km2,年平均径流量1.49×10¹⁰ m3[27],由于水力资源丰富,九龙江建设了较多水电大坝[30],两条支流均独流,在河口处汇流入海,由于河口形状、分布和地貌学等多种因素,九龙江河口不仅接收上游流域的营养物质输入,还受到河口临近区域营养等物质的输入影响[31]。
|
图 1 2010—2020年航次九龙江河口调查站位分布 Fig.1 Sampling sites in Jiulong River Estuary from 2010 to 2020 cruise |
营养物质通量数据基于本研究组2010—2020年每年3个水期营养物质浓度监测,其中,2014年监测包括四季的营养物质浓度及藻类丰度(图 1)。并收集了近40年来已发表的研究论文或报告数据[7, 27, 29, 31-41],社会经济数据来自各地统计年鉴。其中,DIN浓度为NO3-、NO2-和NH4+浓度(以N计)之和,PO43-(以P计)计为DIP,并将所有浓度数据经过盐度归一化计算[42](数据来源及处理详见附表 Ⅰ)。针对DSi浓度零星缺失的数据,使用全部DSi浓度数据的算数平均值代替。径流量(年/月)来自水文监测站数据。盐度归一化计算公式如下:
| $ R=\frac{V_{\mathrm{r}}}{V}=\frac{S_{\mathrm{m}}-S}{S_{\mathrm{m}}-S_{\mathrm{r}}} $ | (1) |
| $ M=\frac{V_{\mathrm{m}}}{V}=\frac{S-S_{\mathrm{r}}}{S_{\mathrm{m}}-S_{\mathrm{r}}} $ | (2) |
式中,R和M分别表示在一定盐度下淡水和海水的比例;Vr、Vm和V分别表示淡水、海水和混合水的体积;Sr、Sm和S分别表示淡水、海水和混合水的盐度。九龙江河口Sr=0‰,Sm=34‰,一定盐度下的营养盐浓度换算公式如(3)所示:
| $ C=R \cdot C_{\mathrm{r}}+M \cdot C_{\mathrm{m}} $ | (3) |
式中,C表示混合水中的营养盐浓度;Cr和Cm分别表示河流端淡水和海水营养盐浓度。
1.3 通量及富营养化潜力指数计算方法本研究计算九龙江河口的入海通量参考相关文献[15, 27],公式为:
| $ F=C \cdot Q $ | (4) |
式中,F为调查断面的营养物质通量,C为调查断面的营养物质平均浓度,Q为河流的平均(年/月)径流量。
ICEP计算参考相关文献[15, 24, 43],与以往仅考虑的N/P不同[44],ICEP基于Redfield比率(106 C∶16 N∶1 P∶20 Si)[18],结合了营养浓度和化学计量比,被用来评估受纳水体中溶解营养物质比例的改变和非硅质藻类的生产力,ICEP指数计算如下:
| $ \text { N-ICEP }=[N F l x /(14 \times 16)-S i F l x /(28 \times 20)] \times 106 \times 12 $ | (5) |
| $ \text { P-ICEP }=[P F l x / 31-S i F l x /(28 \times 20)] \times 106 \times 12 $ | (6) |
式中,NFlx、PFlx和SiFlx分别代表N、P和Si的河流年/季度平均通量。非硅质藻类生产力以kg C/(km2·d)表示。公式(5)表示N和Si之间的不平衡,即用以N计算的生产力,公式(6)类似,以P计算的生产力。
1.4 数据分析基于Mann-Whitney检验分析相关指标的差异显著性,利用通径分析(IBM SPSS 26.0和R 4.2)来评估Chl.a浓度与环境之间的相关性、潜在的直接和间接影响以及各参数之间潜在的直接和间接影响,利用聚类分析、主成分分析进行四季N-ICEP、P-ICEP指数和相关指标的差异性和相关性分析,使用ANOVA检验分析P-ICEP、N-ICEP和叶绿素a、硅藻丰度的季节性差异,基于Pearson相关分析ICEP与流域社会经济相关关系。本研究的统计分析均使用R 4.2。
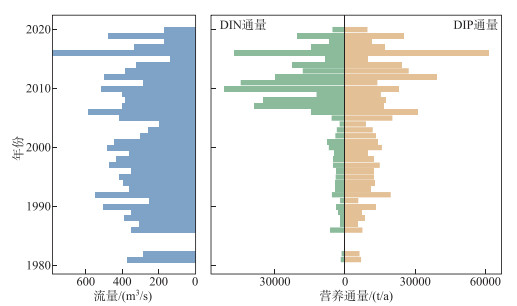
2 结果 2.1 九龙江河口营养浓度及负荷变化趋势九龙江河口区DIN浓度年均值和DIP浓度年均值呈波动变化(图 2)。近年来九龙江径流量未产生明显的年际变化(P>0.05)(图 3),2016年的高流量可归因于超强台风“莫兰蒂”带来的高强度降雨。1980s以来,九龙江河口的营养负荷发生显著变化(P<0.05)(图 3),特别是N负荷的显著增加(P<0.05)。DIN和DIP通量的变化与DIN和DIP浓度变化趋势一致,均表现为1980s-2006年缓慢增长,而2006—2020年期间增长迅速,流量变化较小的情况下,DIN和DIP通量受DIN和DIP浓度波动幅度影响大。1980s-2006年期间氮通量平均值为3.967×10³ t/a,而2006—2020年期间增加到2.924×104 t/a,增长了637.14%,其中最高值达8.279×104 t/a。两个时期磷通量平均值分别为1.131×102和2.282×102 t/a,增长了101.87%,其中最高值达6.128×102 t/a。收集到的DSi浓度数据表明九龙江河口区DSi浓度近40年来无显著变化(P>0.05)。九龙江多处筑坝、流域农业开发活动和土地利用变化所引起的河流DSi浓度的正负变化基本抵消,使得河口区自1980s以来DSi浓度并无显著变化,这与其他学者的研究结论一致[44]。

|
图 2 九龙江河口(a)DIN和(b)DIP年均浓度变化(黑色线为浓度变化范围) Fig.2 Mean annual concentration of (a) DIN and (b) DIP in Jiulong River Estuary |
|
图 3 九龙江河口逐年流量及营养通量 Fig.3 Annual discharges and nutrient fluxes in Jiulong River Estuary |
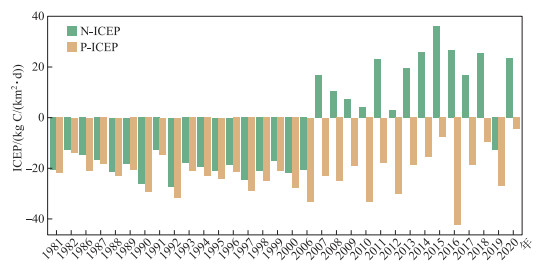
1980s至今,九龙江河口ICEP存在显著的波动变化特征(P<0.05),九龙江河口P-ICEP值连续表现为负值;而自2006年后,N-ICEP波动基本在正值区间(图 4),这与N通量在2006年后出现明显的增长趋势一致(图 3),N-ICEP自1980s-2006年期间平均值从-19.521 kg C/(km2·d)增加至2006—2020年期间平均值17.694 kg C/(km2·d)。而P-ICEP基本在负值期间波动,表现与N-ICEP变化不同的特征,说明P是限制非硅质藻类的重要因子,从绝对值来看,最高P-ICEP值出现在2016年,为-42.371 kg C/(km2·d),这与2016年DIP浓度和DIP通量均为最高一致。
|
图 4 九龙江河口N-ICEP和P-ICEP时间序列变化 Fig.4 The changes in yearly N-ICEP and P-ICEP in the Jiulong River Estuary |
九龙江地表径流年内分配不均,径流量主要集中在汛期。九龙江丰水期(4—9月份)多年平均径流总量占全年的73.52%,枯水期10月到翌年3月的径流总量只占全年的26.48%。多年月平均径流量最大出现在6月(7.961×10² m3/s),最小出现在1月(1.394×102 m3/s)(表 1)。因此,仅考虑流量的季节性因素,不同季节的营养通量就可能存在较大的差异。
| 表 1 九龙江逐月平均流量及占全年比例表 Tab. 1 Monthly average discharges and their percentages in annual discharges in Jiulong River |
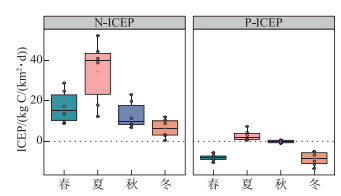
自2006年后,N负荷增加导致的河口富营养化风险增高,并且存在较显著的季节性波动。N-ICEP在不同季节的平均值均大于0,N-ICEP波动范围为0.456~52.098 kg C/(km2·d),特别是夏季的中位值和平均值均为最大,而P-ICEP波动范围为-9.759~7.343 kg C/(km2·d)。因此,九龙江河口由N、P负荷带来的富营养化风险均表现为夏季最高,而其他季节由N负荷带来的富营养风险也不容忽视(图 5)。
|
图 5 九龙江河口N-ICEP和P-ICEP季节变化 Fig.5 Seasonal variations in N-ICEP and P-ICEP |
Chl.a浓度是藻类生物量的指标,反映了水质因素的生态效应[45]。不同季节Chl.a浓度差异大,最高的Chl.a浓度是最低的125.01倍,Chl.a浓度表现为夏季最高,冬季最低(图 6a),与N-ICEP值的季节变化规律一致。而硅藻丰度与N-ICEP和P-ICEP值季节变化相反(图 6b),夏季硅藻丰度显著低于其他季节(P<0.05),夏季硅藻平均丰度为8.055×10⁴ cells/L,冬季硅藻平均丰度是夏季的4.677倍。总体而言,夏季表现为藻类丰度高,但硅藻丰度低的特点,冬季则相反。

|
图 6 Chl.a浓度和硅藻丰度季节变化 Fig.6 Seasonal variations in Chl.a and diatom abundance |
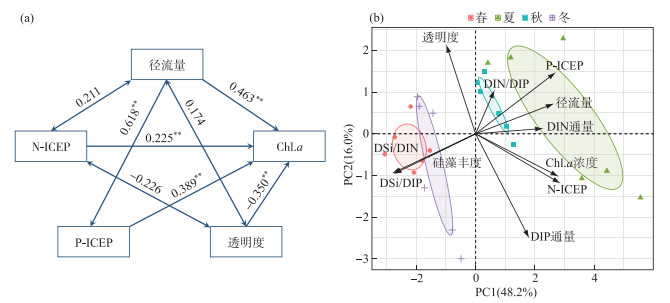
径流量、N-ICEP、P-ICEP对Chl.a浓度存在显著的正向影响(图 7a),标准化路径系数分别为0.463(P<0.01)、0.225(P<0.01)和0.389(P<0.01),水体透明度对Chl.a浓度存在显著负向影响。Chl.a浓度与DIN和DIP通量、N-ICEP、P-ICEP均存在正相关关系,硅藻丰度与DSi/DIN、DSi/DIP呈显著正相关(P<0.05),且与N-ICEP、P-ICEP呈负相关关系(图 7b)。
|
图 7 Chl.a浓度与环境变量通径分析(a)和不同季节环境生态因子PCA分析(b) ((a)中单箭头代表直接因果途径,而双箭头代表相关关系,数字表示关系的影响大小,**表示显著水平P<0.01) Fig.7 Path analysis of environmental factors and Chl.a concentrations(a) and Seasonal PCA analyses of environmental and ecological factors(b) |
河口水域的富营养化不仅与上游河流的营养输送有关,也跟河口区域的自然地貌特征有关[46]。河口形状与地貌、潮差、水力停留时间及其河口相关物理过程影响河口的藻类的消长以及群落结构[47-48]。除了不同季节河流的流量存在季节差异外,营养通量取决于流域面源、生活污水、养殖污水和工业废水的输入,以及筑坝等其他因素[40]。2000—2005年是水电站密集建设期(表 2),即自2006年起,九龙江流域大量水电站建成使用,库坝显著改变了河流的纵向连通性、改变了水文与水动力过程,加上流域快速的城市化以及人口增加等因素,不仅增加了河流的营养通量(图 8),成为富营养化程度加重的根源[49],同时也可能改变了河口区的营养结构[41],高营养负荷还促使了河口水体藻类的生长,使得N-ICEP自2006年以后基本在正值区波动。因此,人类活动是造成河口富营养化的主要因素,但自然因素也不容忽视。
| 表 2 九龙江不同时期平均流量、水电站数量以及营养通量 Tab. 2 Number of hydropower stations, average discharges and nutrient fluxes in different periods in Jiulong River |
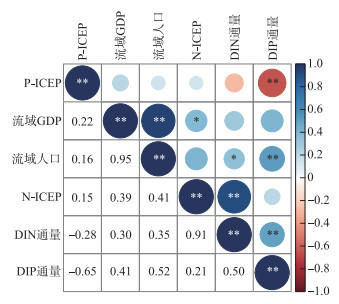
|
图 8 ICEP与流域社会经济相关关系 Fig.8 Correlation between ICEP and socio-economic indicators |
ICEP方法已经被用于全球[24]和区域[50, 51-54]的河流输入对河口富营养化影响的评估与预测,并认为发展中国家沿海富营养化风险到2050年将有所增加。Strokal等[51]预测未来中国海域的沿海富营养化趋势将恶化,而黄河营养输入对渤海的影响表现为P-ICEP为负值,N-ICEP为正值[52];三峡大坝建设导致长江口的非硅藻类、潜在有害的藻类每年过量生长27 Tg C[55]。本研究中夏季N-ICEP及P-ICEP均为正值,与夏季硅藻丰度最低的结果相互印证,说明ICEP方法可被作为河口藻类生物量及非硅质藻类的生长潜力的评估及预测工具。
在九龙江河口,本研究不仅提供了营养通量的年平均值及富营养化趋势,同时提供有关季节性营养通量的信息。在过去几十年里九龙江进入河口的DIP通量整体为增加趋势,但P-ICEP均是负值,根据Redfield比率相对于Si而言,P是不足的,这与前期的研究结果九龙江口主要受P限制一致,河口DIN/DIP的变化趋势表现为逐渐升高[27]。河口季节Chl.a浓度与N-ICEP、P-ICEP均呈显著相关(P<0.01)(图 7b),这与其他研究相类似[50],特别是在P限制明显的地中海水域[56-57]。此外,与N-ICEP相比,P-ICEP对Chl.a浓度影响更大,其标准化系数是N-ICEP的1.73倍(图 7a),说明相对于N来说,P对河口藻类生物量的季节变化的调控更重要[58]。除N-ICEP和P-ICEP对Chl.a浓度存在显著影响外,水体透明度、河流径流量和DIN、DIP和DSi相应比值也是影响Chl.a浓度的重要因子(图 7),这说明水体透明度降低使得光可利用性下降,最终导致Chl.a浓度降低[59],而河流径流量为浮游植物的生长提供了大量营养[60]。DIN、DIP和DSi的浓度及其相应比值变化对藻类群落结构具有较大影响[61-62],而这些浓度和比值都受到人类活动影响的变化而变化。营养元素通量的季节变化表明冬、春两季藻类生长受单一P限制,随着硅藻的生长以及Si元素的消耗,夏、秋两季的藻类生长逐渐叠加了Si限制,发展为受P、Si共同限制(图 9),使得硅藻丰度在冬、春两季较高,而夏、秋两季的硅藻丰度降低(图 6),并导致了夏、秋季节N-ICEP和P-ICEP均值均大于春、冬季节。
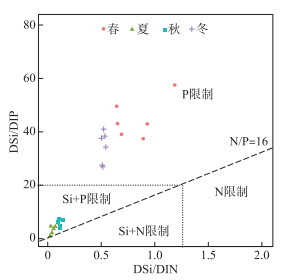
|
图 9 九龙江口四季营养(DIN、DIP、DSi)的摩尔比 Fig.9 Seasonal plot of nutrient (DIN, DIP, DSi) molar ratios in the Jiulong River Estuary |
虽然ICEP为负值表明河口富营养化的风险较低,但并不代表藻类大量繁殖是零风险[24],这是因为藻类的大量繁殖还受到其他因素的影响,如温度、光照等气象因素[24]。但ICEP依然具有作为一种综合生物地球化学监测与富营养化预警工具的潜力,ICEP在《2030年可持续发展议程》14.1.1中被列为表征沿海富营养化的参数之一[63-64]。还可将ICEP与气候变化预测等模型耦合,用于评估气候变化下沿海富营养化的趋势。由于藻类的生长更容易受到季节性等因素的制约[30],因此在应对富营养化问题时,需要加强比年尺度更详细的时间尺度(如季节尺度以及月尺度)的监测和预警,从而深化理解沿海富营养化的影响机制。此外,ICEP直接反映了N、P、Si比例平衡状态和生态效应,在未来可持续管理目标下,可以考虑将该指数作为生态目标纳入河口和流域的管理决策中[54, 65]。
4 结论多时间尺度序列的ICEP分析有助于分析营养物质浓度或结构发生明显变化的影响和结果。九龙江河口ICEP与人类活动密切相关,特别是在2006年大量闸坝建设运行以后,九龙江河口富营养化的风险具有升高趋势,其中,富营养化风险冬季相对较低,夏季最高。因此在应对处理富营养化问题时,需要考虑季节因素。ICEP方法可被作为河口藻类及非硅质藻类生长潜力的评估和预测工具。此外,河口生态系统初级生产力总体上受到P限制,但具有季节性差异,其中夏、秋季受P、Si共同限制。相对于N来说,P对河口藻类生物量的季节变化的调控更重要。但ICEP工具的局限为仅考虑河流营养物质输出通量和结构变化单一因素的生态影响。综上,ICEP直接反映了N、P、Si比例平衡状态和生态效应,在未来可持续管理目标下,可以考虑将该指数作为生态目标纳入河口和流域的管理决策中。
5 附录附表 Ⅰ见电子版(DOI: 10.18307/2023.0626.)。
| 附表Ⅰ 数据来源 Appendix Ⅰ Data Sources |
| [1] |
Kennish MJ. Environmental threats and environmental future of estuaries. Environ Conserv, 2002, 29(1): 78-107. DOI:10.1017/S0376892902000061 |
| [2] |
Mclusky D, Elliott M. The Estuarine Ecosystem. Ecology, Threats and Management. New York: Springer, 2004: 30-61.
|
| [3] |
Lotze HK, Lenihan HS, Bourque BJ et al. Depletion, degradation, and recovery potential of estuaries and coastal seas. Science, 2006, 312(5781): 1806-1809. DOI:10.1126/science.1128035 |
| [4] |
Barbier EB, Hacker SD, Kennedy C et al. The value of estuarine and coastal ecosystem services. Ecol Monogr, 2011, 81(2): 169-193. DOI:10.1890/10-1510.1 |
| [5] |
Penuelas J, Janssens IA, Ciais P et al. Anthropogenic global shifts in biospheric N and P concentrations and ratios and their impacts on biodiversity, ecosystem productivity, food security, and human health. Global Change Biol, 2020, 26(4): 1962-1985. DOI:10.1111/gcb.14981 |
| [6] |
Penuelas J, Sardans J. The global nitrogen-phosphorus imbalance. Science, 2022, 375(6578): 266-267. DOI:10.1126/science.abl4827 |
| [7] |
Wu GJ, Cao WZ, Wang FF et al. Riverine nutrient fluxes and environmental effects on China's estuaries. Science of the Total Environment, 2019, 661: 130-137. DOI:10.1016/j.scitotenv.2019.01.120 |
| [8] |
Richardson K, Jorgensen B. Eutrophication in coastal marine ecosystems. Washington: American Geophysical Union, 1996: 95-114.
|
| [9] |
Cloern JE. Our evolving conceptual model of the coastal eutrophication problem. Mar Ecol Prog Ser, 2001, 210: 223-253. DOI:10.3354/meps210223 |
| [10] |
Conley DJ, Carstensen J, Aertebjerg G et al. Long-term changes and impacts of hypoxia in Danish coastal waters. Ecol Appl, 2007, 17(5): S165-S84. DOI:10.1890/05-0766.1 |
| [11] |
Maavara T, Chen QW, Van Meter K et al. River dam impacts on biogeochemical cycling. Nat Rev Earth Env, 2020, 1(2): 103-116. DOI:10.1038/s43017-019-0019-0 |
| [12] |
Maranger R, Jones SE, Cotner JB. Stoichiometry of carbon, nitrogen, and phosphorus through the freshwater pipe. Limnol Oceanogr Lett, 2018, 3(3): 89-101. DOI:10.1002/lol2.10080 |
| [13] |
Friedl G, Wuest A. Disrupting biogeochemical cycles—Consequences of damming. Aquatic Sciences, 2002, 64(1): 55-65. DOI: UNSP1015-1621/02/010055-11.
|
| [14] |
Vorosmarty CJ, Sharma KP, Fekete BM et al. The storage and aging of continental runoff in large reservoir systems of the world. Ambio, 1997, 26(4): 210-219. DOI:10.1007/s00027-002-8054-0 |
| [15] |
Billen G, Garnier J. River basin nutrient delivery to the coastal sea: Assessing its potential to sustain new production of non-siliceous algae. Mar Chem, 2007, 106(1-2): 148-160. DOI:10.1016/j.marchem.2006.12.017 |
| [16] |
Zhou MJ, Shen ZL, Yu RC. Responses of a coastal phytoplankton community to increased nutrient input from the Changjiang (Yangtze) River. Cont Shelf Res, 2008, 28(12): 1483-1489. DOI:10.1016/j.csr.2007.02.009 |
| [17] |
Justic D, Rabalais NN, Turner RE et al. Changes in nutrient structure of river-dominated coastal waters-stoichiometric nutrient balance and its consequences. Estuar Coast Shelf S, 1995, 40(3): 339-356. DOI:10.1016/S0272-7714(05)80014-9 |
| [18] |
Redfield AC. The influence of organisms on the composition of seawater. The sea: Ideas and Observations on Progress in the Study of the Seas, 1963, 2: 26-77. |
| [19] |
Conley DJ, Schelske CL, Stoermer EF. Modification of the biogeochemical cycle of silica with eutrophication. Mar Ecol Prog Ser, 1993, 101(1-2): 179-192. DOI:10.3354/meps101179 |
| [20] |
Board OS, Council NR. Clean coastal waters: Understanding and reducing the effects of nutrient pollution. Washington, DC: The National Academies Press, 2000. DOI:10.17226/9812
|
| [21] |
Chaffin JD, Bridgeman TB, Bade DL et al. Summer phytoplankton nutrient limitation in Maumee Bay of Lake Erie during high-flow and low-flow years. J Great Lakes Res, 2014, 40(3): 524-531. DOI:10.1016/j.jglr.2014.04.009 |
| [22] |
Yan ZB, Han WX, Penuelas J et al. Phosphorus accumulates faster than nitrogen globally in freshwater ecosystems under anthropogenic impacts. Ecol Lett, 2016, 19(10): 1237-1246. DOI:10.1111/ele.12658 |
| [23] |
Zhang Y, Song C, Ji L et al. Cause and effect of N/P ratio decline with eutrophication aggravation in shallow lakes. Sci Total Environ, 2018, 627: 1294-1302. DOI:10.1016/j.scitotenv.2018.01.327 |
| [24] |
Garnier J, Beusen A, Thieu V et al. N∶P∶Si nutrient export ratios and ecological consequences in coastal seas evaluated by the ICEP approach. Global Biogeochemical Cycles, 2010, 24: Gb0a05. DOI:10.1029/2009gb003583 |
| [25] |
Billen G, Silvestre M, Grizzetti B et al. Nitrogen flows from European regional watersheds to coastal marine waters. In: Sutton M, Howard C, Erisman J et al. The European nitrogen assessment: Sources, effects and policy perspectives. Cambridge: Cambridge University Press, 2011: 271-297. DOI: 10.1017/CBO9780511976988.016.
|
| [26] |
Royer TV. Stoichiometry of nitrogen, phosphorus, and silica loads in the Mississippi-Atchafalaya River basin reveals spatial and temporal patterns in risk for cyanobacterial blooms. Limnol Oceanogr, 2020, 65(2): 325-335. DOI:10.1002/lno.11300 |
| [27] |
Wu GJ, Cao WZ, Huang Z et al. Decadal changes in nutrient fluxes and environmental effects in the Jiulong River Estuary. Mar Pollut Bull, 2017, 124(2): 871-877. DOI:10.1016/j.marpolbul.2017.01.071 |
| [28] |
Luo ZB, Pan WR, Li L et al. The study on three-dimensional numerical model and fronts of the Jiulong Estuary and the Xiamen Bay. Acta Oceanol Sin, 2012, 31(4): 55-64. DOI:10.1007/s13131-012-0220-1 |
| [29] |
Chen ST, Ruan WQ, Zhang LP. Chemical properties of nutrients in the Jiulong River Estuary and estimation of their fluxes to the sea. Tropical Ocean, 1985(4): 16-24. [陈水土, 阮五崎, 张立平. 九龙江口诸营养要素的化学特性及其入海通量估算. 热带海洋, 1985(4): 16-24.] |
| [30] |
Lin L, Wang FF, Chen H et al. Ecological health assessments of rivers with multiple dams based on the biological integrity of phytoplankton: A case study of North Creek of Jiulong River. Ecological Indicators, 2021, 121: 106998. DOI:10.1016/j.ecolind.2020.106998 |
| [31] |
Cao WZ, Hong HS, Yue SP. Modelling agricultural nitrogen contributions to the Jiulong River estuary and coastal water. Globa Planet Change, 2005, 47(2-4): 111-121. DOI:10.1016/j.gloplacha.2004.10.006 |
| [32] |
Zhang YH, Wang WQ, Huang ZQ. Salinity fronts and chemical behaviour of nutrient in Jiulong River Estuary. Marine Environmental Science, 1999(4): 1-7. [张远辉, 王伟强, 黄自强. 九龙江口盐度锋面及其营养盐的化学行为. 海洋环境科学, 1999(4): 1-7. DOI:10.3969/j.issn.1007-6336.1999.04.001] |
| [33] |
Yang YP, Hu MH, Chen HL et al. Behavior of bioavailable phosphorus and marine fluxes in the Jiulong River Estuary. Taiwan Strait, 1998(3): 269-274. [杨逸萍, 胡明辉, 陈海龙等. 九龙江口生物可利用磷的行为与入海通量. 台湾海峡, 1998(3): 269-274.] |
| [34] |
Lin H, Zhang YB, Chen JM. Eutrophication assessment of seawater for Xiamen sea area. Journal of Applied Oceanography, 2002(2): 154-161. [林辉, 张元标, 陈金民. 厦门海域水体富营养程度评价. 应用海洋学学报, 2002(2): 154-161. DOI:10.3969/j.issn.1000-8160.2002.02.002] |
| [35] |
Ji WD, Huang SG, Wang WQ. Additions of nitrate to the Jiulong River Estuary. Marine Bulletin, 1987(2): 19-22. [暨卫东, 黄尚高, 王伟强. 九龙江口硝酸盐的增补现象. 海洋通报, 1987(2): 19-22.] |
| [36] |
Chen ST, Zheng RZ, Zhang F et al. Distribution and transformation of inorganic nitrogen in the Jiulong River Estuary and Xiamen West Sea. Marine Lake and Marsh Bulletin, 1993(4): 28-35. [陈水土, 郑瑞芝, 张钒等. 九龙江口、厦门西海域无机氮的分布与转化. 海洋湖沼通报, 1993(4): 28-35.] |
| [37] |
Chen BH, Lin H, Zhang CH et al. Trends of inorganic nitrogen and reactive phosphate in Xiamen waters. Taiwan Strait, 2010, 29(3): 314-319. [陈宝红, 林辉, 张春华等. 厦门海域水体无机氮和活性磷酸盐含量的变化趋势. 台湾海峡, 2010, 29(3): 314-319.] |
| [38] |
Chen NW, Wu YQ, Wu JZ et al. Natural and human influences on dissolved silica export from watershed to coast in Southeast China. J Geophys Res-Biogeo, 2014, 119(1): 95-109. DOI:10.1002/2013jg002429 |
| [39] |
Chen NW, Peng BR, Hong HS et al. Nutrient enrichment and N∶P ratio decline in a coastal bay-river system in southeast China: The need for a dual nutrient (N and P) management strategy. Ocean Coast Manage, 2013, 81: 7-13. DOI:10.1016/j.ocecoaman.2012.07.013 |
| [40] |
Cao WZ, Huang Z, Zhai WD et al. Isotopic evidence on multiple sources of nitrogen in the northern jiulong River, Southeast China. Estuar Coast Shelf S, 2015, 163: 37-43. DOI:10.1016/j.ecss.2015.05.042 |
| [41] |
Chen JS, Cao WZ, Cao D et al. Nitrogen loading and nitrous oxide emissions from a river with multiple hydroelectric reservoirs. B Environ Contam Tox, 2015, 94(5): 633-639. DOI:10.1007/s00128-015-1525-5 |
| [42] |
Liu BL, Cao WZ, Huang Z et al. Developing nutrient criteria for the Jiulong River Estuary, Southeast China. Acta Oceanol Sin, 2018, 37(2): 1-13. DOI:10.1007/s13131-017-1121-0 |
| [43] |
Glibert PM, Mayorga E, Seitzinger S. Prorocentrum minimum tracks anthropogenic nitrogen and phosphorus inputs. on a global basis: Application of spatially explicit nutrient export models. Harmful Algae, 2008, 8(1): 33-38. DOI:10.1016/j.hal.2008.08.023 |
| [44] |
Chen NW. Processes, fluxes and effects of nutrient cycling in the Jiulong River river-estuary system under global change. Marine Geology and Quaternary Geology, 2018, 38(1): 23-31. [陈能汪. 全球变化下九龙江河流-河口系统营养盐循环过程、通量与效应. 海洋地质与第四纪地质, 2018, 38(1): 23-31.] |
| [45] |
Boyer JN, Kelble CR, Ortner PB et al. Phytoplankton bloom status: Chlorophyll-a biomass as an indicator of water quality condition in the southern estuaries of Florida, USA. Ecological Indicators, 2009, 9: S56-S67. DOI:10.1016/j.ecolind.2008.11.013 |
| [46] |
Rabouille C, Conley DJ, Dai MH et al. Comparison of hypoxia among four river-dominated ocean margins: The Changjiang (Yangtze), Mississippi, Pearl, and Rhone rivers. Cont Shelf Res, 2008, 28(12): 1527-37. DOI:10.1016/j.csr.2008.01.020 |
| [47] |
Monbet Y. Control of phytoplankton biomass in estuaries-a comparative-analysis of microtidal and macrotidal estuaries. Estuaries, 1992, 15(4): 563-571. DOI:10.2307/1352398 |
| [48] |
Kudela RM, Lane JQ, Cochlan WP. The potential role of anthropogenically derived nitrogen in the growth of harmful algae in California, USA. Harmful Algae, 2008, 8(1): 103-110. DOI:10.1016/j.hal.2008.08.019 |
| [49] |
Li JL, Zheng BH, Zhang LS et al. Eutrophication characteristics and variation analysis of estuaries in China. China Environmental Science, 2016, 36(2): 506-516. [李俊龙, 郑丙辉, 张铃松等. 中国主要河口海湾富营养化特征及差异分析. 中国环境科学, 2016, 36(2): 506-516.] |
| [50] |
Romero E, Garnier J, Lassaletta L et al. Large-scale patterns of river inputs in southwestern Europe: Seasonal and interannual variations and potential eutrophication effects at the coastal zone. Biogeochemistry, 2013, 113(1-3): 481-505. DOI:10.1007/s10533-012-9778-0 |
| [51] |
Strokal M, Yang H, Zhang YC et al. Increasing eutrophication in the coastal seas of China from 1970 to 2050. Mar Pollut Bull, 2014, 85(1): 123-140. DOI:10.1016/j.marpolbul.2014.06.011 |
| [52] |
Liu SM, Li LW, Zhang GL et al. Impacts of human activities on nutrient transports in the Huanghe (Yellow River) estuary. J Hydrol, 2012, 430: 103-110. DOI:10.1016/j.jhydrol.2012.02.005 |
| [53] |
Strokal M, Kroeze C. Nitrogen and phosphorus inputs to the Black Sea in 1970-2050. Regional Environmental Change, 2013, 13(1): 179-92. DOI:10.1007/s10113-012-0328-z |
| [54] |
Wang M, Janssen AG, Bazin J et al. Accounting for interactions between Sustainable Development Goals is essential for water pollution control in China. Nat Commun, 2022, 13(1): 730. DOI:10.1038/s41467-022-28351-3 |
| [55] |
Ran XB, Bouwman AF, Yu ZG et al. Implications of eutrophication for biogeochemical processes in the Three Gorges Reservoir, China. Regional Environmental Change, 2019, 19(1): 55-63. DOI:10.1007/s10113-018-1382-y |
| [56] |
Thingstad TF, Zweifel UL, Rassoulzadegan F. P limitation of heterotrophic bacteria and phytoplankton in the northwest Mediterranean. Limnol Oceanogr, 1998, 43(1): 88-94. DOI:10.4319/lo.1998.43.1.0088 |
| [57] |
Thingstad TF, Krom MD, Mantoura RFC et al. Nature of phosphorus limitation in the ultraoligotrophic eastern Mediterranean. Science, 2005, 309(5737): 1068-1071. DOI:10.1126/science.1112632 |
| [58] |
Wang RZ, Wang PF, Ren LX et al. Effects of nutrient inputs on changes of phosphorus forms and phytoplankton growth in Taihu Lake. Environmental Science, 2015, 36(4): 1301-1308. [王睿喆, 王沛芳, 任凌霄等. 营养盐输入对太湖水体中磷形态转化及藻类生长的影响. 环境科学, 2015, 36(4): 1301-1308. DOI:10.13227/j.hjkx.2015.04.022] |
| [59] |
Gao L, Yao HY, Zhang MM et al. Temporal and spatial variation of seawater transparency and its relationship with environmental factors in Qingdao coastal area. Journal of Marine Sciences, 2017, 35(3): 79-84. [高磊, 姚海燕, 张蒙蒙等. 青岛近岸海域海水透明度时空变化及与环境因子之间的关系. 海洋学研究, 2017, 35(3): 79-84. DOI:10.3969/j.issn.1001-909X.2017.03.009] |
| [60] |
Liu HJ, Huang LM, Tan YH et al. Seasonal variations of chlorophyll-a and primary production and their influencing factors in the Pearl River Estuary. Journal of Tropical Oceanography, 2017, 36(1): 81-91. [刘华健, 黄良民, 谭烨辉等. 珠江口浮游植物叶绿素a和初级生产力的季节变化及其影响因素. 热带海洋学报, 2017, 36(1): 81-91. DOI:10.11978/2016033] |
| [61] |
Xu H, Chen J, Zhu GW et al. Effect of concentrations of phosphorus and nitrogen on the dominance of cyanobacteria. J Lake Sci, 2019, 31(5): 1239-1247. [许海, 陈洁, 朱广伟等. 水体氮、磷营养盐水平对蓝藻优势形成的影响. 湖泊科学, 2019, 31(5): 1239-1247. DOI:10.18307/2019.0518] |
| [62] |
Justic D, Rabalais NN, Turner RE. Stoichiometric nutrient balance and origin of coastal eutrophication. Mar Pollut Bull, 1995, 30(1): 41-46. DOI:10.1016/0025-326x(94)00105-I |
| [63] |
Nation U. Transforming our world: The 2030 Agenda for Sustainable Development: Resolution. New York, 2015.
|
| [64] |
IAEG-SDGS. Compilation of metadata for the proposed global indicators for the review of the 2030 agenda for sustainable development. New York, 2016.
|
| [65] |
Wang C, Sun QY, Wang PF et al. An optimization approach to runoff regulation for potential estuarine eutrophication control: Model development and a case study of Yangtze Estuary, China. Ecological Modelling, 2013, 251: 199-210. DOI:10.1016/j.ecolmodel.2012.12.026 |
 2023, Vol. 35

